Over the past six months, JFrog’s shares (currently trading at $32.56) have posted a disappointing 14% loss, well below the S&P 500’s 8.1% gain. This might have investors contemplating their next move.
Following the pullback, is this a buying opportunity for FROG? Find out in our full research report, it’s free.
Why Does FROG Stock Spark Debate?
Named after the founders' affinity for frogs, JFrog (NASDAQ: FROG) provides a software-as-a-service platform that makes developing and releasing software easier and faster, especially for large teams.
Two Positive Attributes:
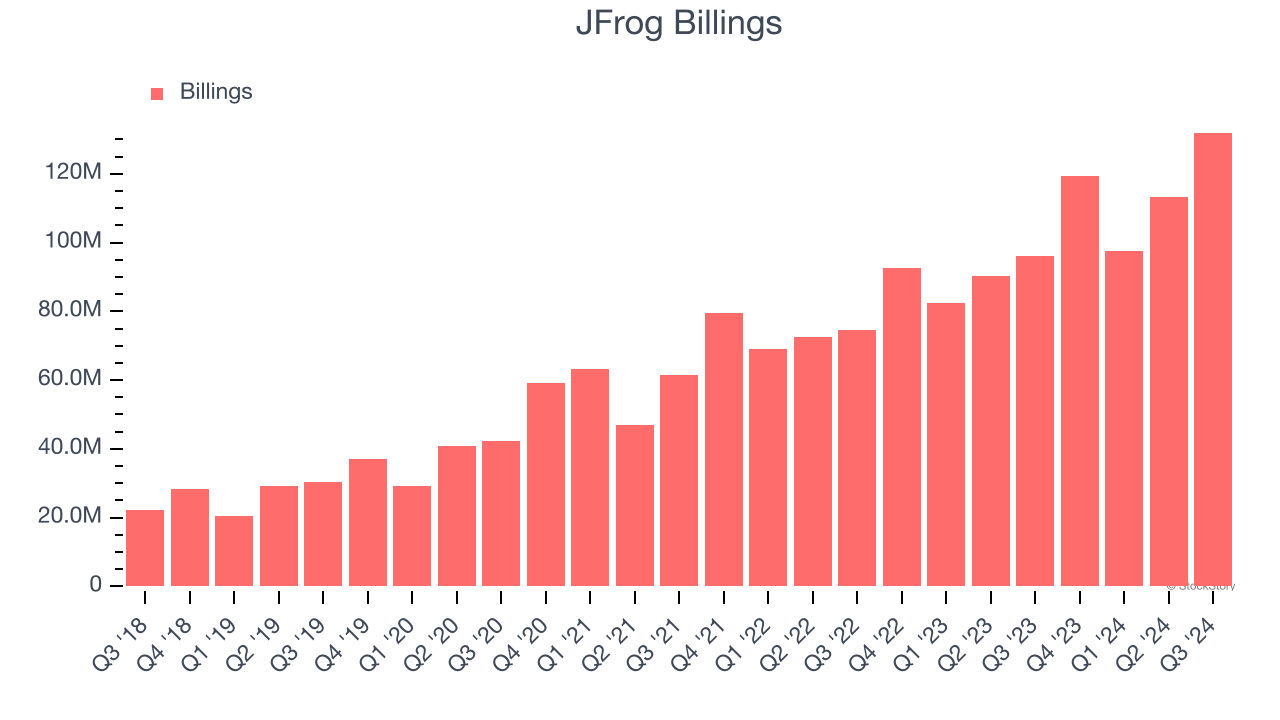
1. Billings Surge, Boosting Cash On Hand
Billings is a non-GAAP metric that is often called “cash revenue” because it shows how much money the company has collected from customers in a certain period. This is different from revenue, which must be recognized in pieces over the length of a contract.
JFrog’s billings punched in at $132 million in Q3, and over the last four quarters, its year-on-year growth averaged 27.5%. This performance was fantastic, indicating robust customer demand. The high level of cash collected from customers also enhances liquidity and provides a solid foundation for future investments and growth.
2. Outstanding Retention Sets the Stage for Huge Gains
One of the best parts about the software-as-a-service business model (and a reason why they trade at high valuation multiples) is that customers typically spend more on a company’s products and services over time.
JFrog’s net revenue retention rate, a key performance metric measuring how much money existing customers from a year ago are spending today, was 118% in Q3. This means JFrog would’ve grown its revenue by 18% even if it didn’t win any new customers over the last 12 months.
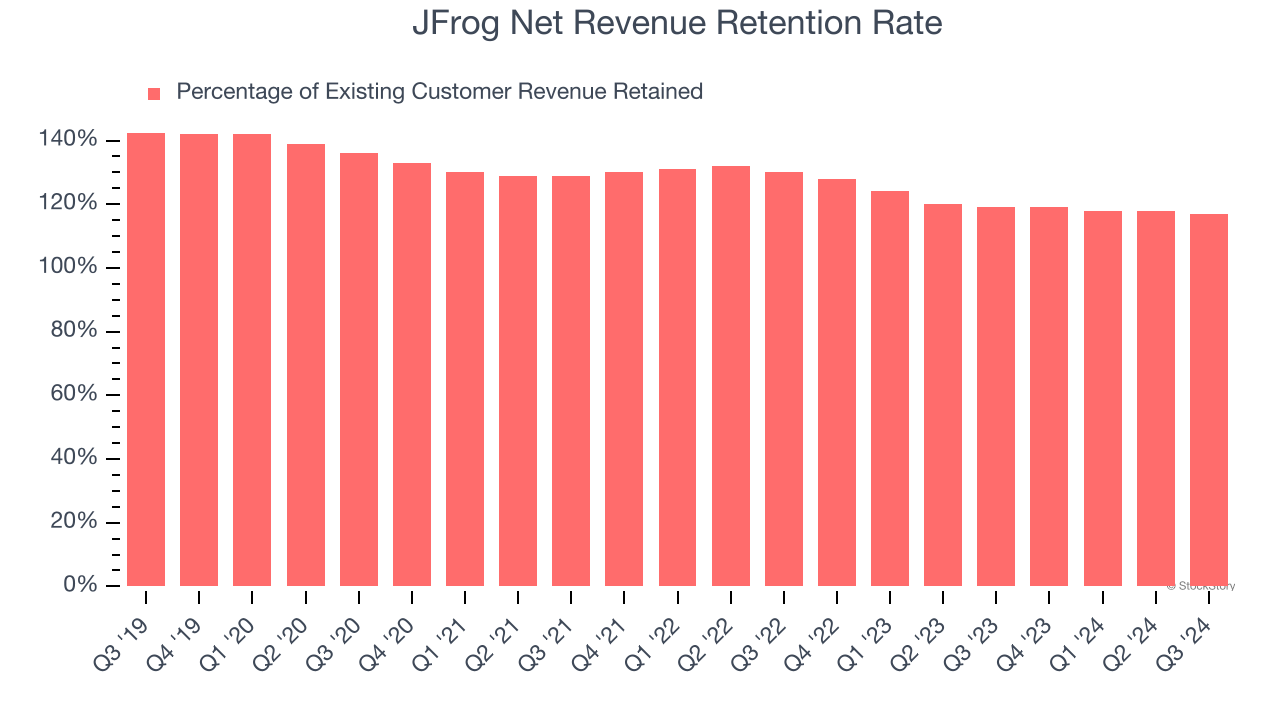
JFrog has a good net retention rate, proving that customers are satisfied with its software and getting more value from it over time, which is always great to see.
One Reason to be Careful:
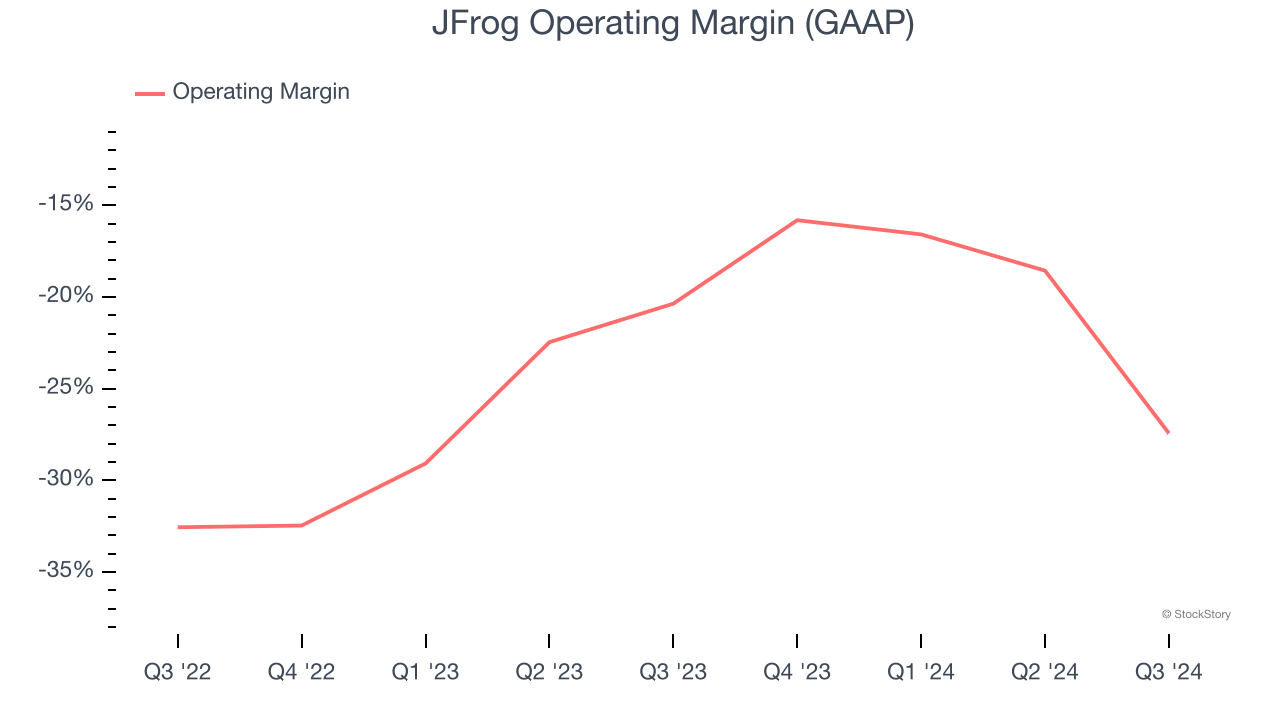
Operating Losses Sound the Alarms
While many software businesses point investors to their adjusted profits, which exclude stock-based compensation (SBC), we prefer GAAP operating margin because SBC is a legitimate expense used to attract and retain talent. This is one of the best measures of profitability because it shows how much money a company takes home after developing, marketing, and selling its products.
JFrog’s expensive cost structure has contributed to an average operating margin of negative 19.8% over the last year. This happened because the company spent loads of money to capture market share. As seen in its fast revenue growth, the aggressive strategy has paid off so far, and Wall Street’s estimates suggest the party will continue. We tend to agree and believe the business has a good chance of reaching profitability upon scale.
Final Judgment
JFrog’s merits more than compensate for its flaws. With the recent decline, the stock trades at 7.6× forward price-to-sales (or $32.56 per share). Is now the right time to buy? See for yourself in our in-depth research report, it’s free.
Stocks We Like Even More Than JFrog
The Trump trade may have passed, but rates are still dropping and inflation is still cooling. Opportunities are ripe for those ready to act - and we’re here to help you pick them.
Get started by checking out our Top 9 Market-Beating Stocks. This is a curated list of our High Quality stocks that have generated a market-beating return of 175% over the last five years.
Stocks that made our list in 2019 include now familiar names such as Nvidia (+2,183% between December 2019 and December 2024) as well as under-the-radar businesses like Comfort Systems (+751% five-year return). Find your next big winner with StockStory today for free.


