Over the past six months, Okta’s shares (currently trading at $87.65) have posted a disappointing 7.8% loss, well below the S&P 500’s 8.1% gain. This might have investors contemplating their next move.
Is there a buying opportunity in Okta, or does it present a risk to your portfolio? Dive into our full research report to see our analyst team’s opinion, it’s free.
Even with the cheaper entry price, we're swiping left on Okta for now. Here are three reasons why we avoid OKTA and a stock we'd rather own.
Why Is Okta Not Exciting?
Founded during the aftermath of the financial crisis in 2009, Okta (NASDAQ: OKTA) is a cloud-based software-as-a-service platform that helps companies manage identity for their employees and customers.
1. Projected Revenue Growth Is Slim
Forecasted revenues by Wall Street analysts signal a company’s potential. Predictions may not always be accurate, but accelerating growth typically boosts valuation multiples and stock prices while slowing growth does the opposite.
Over the next 12 months, sell-side analysts expect Okta’s revenue to rise by 7.7%, a deceleration versus its 30% annualized growth for the past three years. This projection doesn't excite us and suggests its products and services will see some demand headwinds.
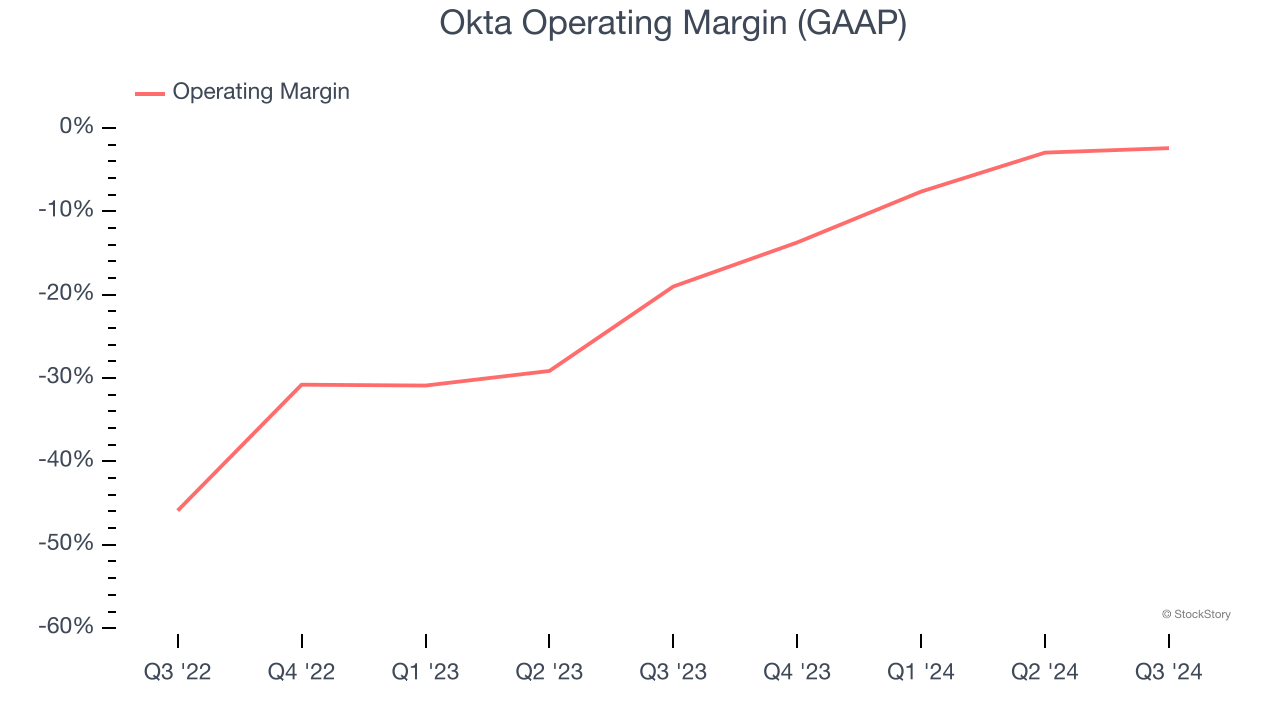
2. Operating Losses Sound the Alarms
While many software businesses point investors to their adjusted profits, which exclude stock-based compensation (SBC), we prefer GAAP operating margin because SBC is a legitimate expense used to attract and retain talent. This is one of the best measures of profitability because it shows how much money a company takes home after developing, marketing, and selling its products.
Okta’s expensive cost structure has contributed to an average operating margin of negative 6.5% over the last year. Unprofitable, high-growth software companies require extra attention because they spend heaps of money to capture market share. As seen in its fast historical revenue growth, this strategy seems to have worked so far, but it’s unclear what would happen if Okta reeled back its investments. Wall Street seems to think it will face some obstacles, and we tend to agree.
3. Free Cash Flow Projections Disappoint
Free cash flow isn't a prominently featured metric in company financials and earnings releases, but we think it's telling because it accounts for all operating and capital expenses, making it tough to manipulate. Cash is king.
Over the next year, analysts’ consensus estimates show they’re expecting Okta’s free cash flow margin of 24.2% for the last 12 months to remain the same.
Final Judgment
Okta isn’t a terrible business, but it isn’t one of our picks. Following the recent decline, the stock trades at 5.5× forward price-to-sales (or $87.65 per share). This valuation is reasonable, but the company’s shakier fundamentals present too much downside risk. We're pretty confident there are superior stocks to buy right now. Let us point you toward Yum! Brands, an all-weather company that owns household favorite Taco Bell.
Stocks We Like More Than Okta
With rates dropping, inflation stabilizing, and the elections in the rearview mirror, all signs point to the start of a new bull run - and we’re laser-focused on finding the best stocks for this upcoming cycle.
Put yourself in the driver’s seat by checking out our Top 5 Growth Stocks for this month. This is a curated list of our High Quality stocks that have generated a market-beating return of 175% over the last five years.
Stocks that made our list in 2019 include now familiar names such as Nvidia (+2,183% between December 2019 and December 2024) as well as under-the-radar businesses like Comfort Systems (+751% five-year return). Find your next big winner with StockStory today for free.