Pilgrim's Pride’s 17.7% return over the past six months has outpaced the S&P 500 by 8.5%, and its stock price has climbed to $46.46 per share. This was partly due to its solid quarterly results, and the run-up might have investors contemplating their next move.
Is there a buying opportunity in Pilgrim's Pride, or does it present a risk to your portfolio? See what our analysts have to say in our full research report, it’s free.
We’re happy investors have made money, but we're swiping left on Pilgrim's Pride for now. Here are three reasons why PPC doesn't excite us and a stock we'd rather own.
Why Is Pilgrim's Pride Not Exciting?
Offering everything from pre-marinated to frozen chicken, Pilgrim’s Pride (NASDAQ: PPC) produces, processes, and distributes chicken products to retailers and food service customers.
1. Projected Revenue Growth Is Slim
Forecasted revenues by Wall Street analysts signal a company’s potential. Predictions may not always be accurate, but accelerating growth typically boosts valuation multiples and stock prices while slowing growth does the opposite.
Over the next 12 months, sell-side analysts expect Pilgrim's Pride’s revenue to rise by 1.9%, a deceleration versus its 9.2% annualized growth for the past three years. This projection is underwhelming and indicates its products will face some demand challenges.
2. Low Gross Margin Reveals Weak Structural Profitability
All else equal, we prefer higher gross margins because they usually indicate that a company sells more differentiated products, has a stronger brand, and commands pricing power.
Pilgrim's Pride has bad unit economics for a consumer staples company, signaling it operates in a competitive market and lacks pricing power because its products can be substituted. As you can see below, it averaged a 8.6% gross margin over the last two years. That means Pilgrim's Pride paid its suppliers a lot of money ($91.40 for every $100 in revenue) to run its business. 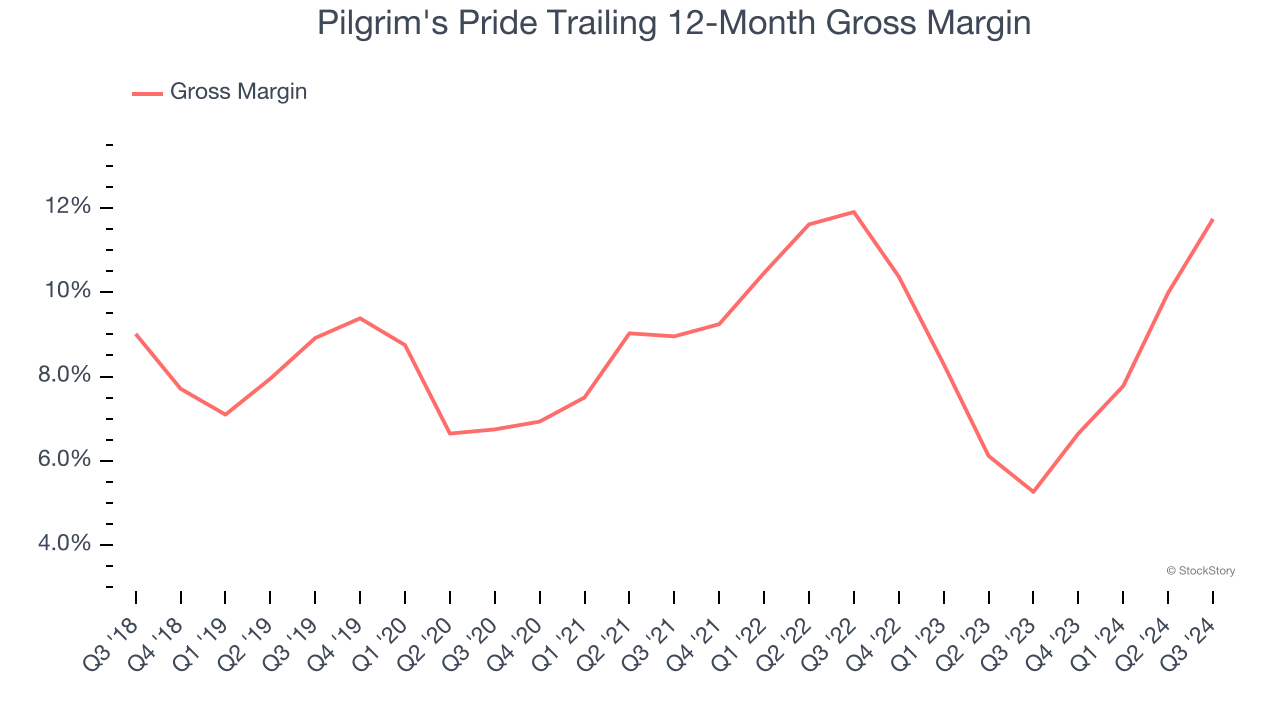
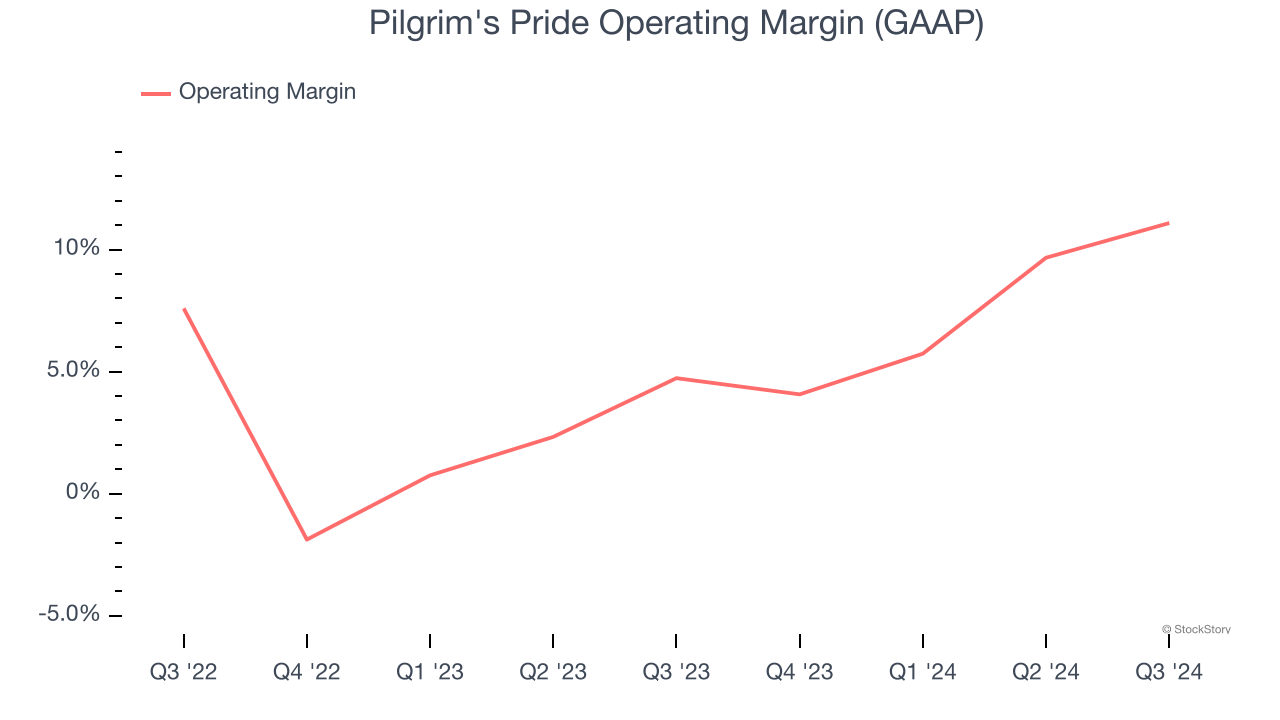
3. Weak Operating Margin Could Cause Trouble
Operating margin is a key measure of profitability. Think of it as net income - the bottom line - excluding the impact of taxes and interest on debt, which are less connected to business fundamentals.
Pilgrim's Pride was profitable over the last two years but held back by its large cost base. Its average operating margin of 4.7% was weak for a consumer staples business. This result isn’t too surprising given its low gross margin as a starting point.
Final Judgment
Pilgrim's Pride isn’t a terrible business, but it doesn’t pass our bar. With its shares outperforming the market lately, the stock trades at 11× forward price-to-earnings (or $46.46 per share). While this valuation is fair, the upside isn’t great compared to the potential downside. We're fairly confident there are better stocks to buy right now. Let us point you toward one of our all-time favorite software stocks with a durable competitive moat.
Stocks We Would Buy Instead of Pilgrim's Pride
The Trump trade may have passed, but rates are still dropping and inflation is still cooling. Opportunities are ripe for those ready to act - and we’re here to help you pick them.
Get started by checking out our Top 9 Market-Beating Stocks. This is a curated list of our High Quality stocks that have generated a market-beating return of 175% over the last five years.
Stocks that made our list in 2019 include now familiar names such as Nvidia (+2,183% between December 2019 and December 2024) as well as under-the-radar businesses like Sterling Infrastructure (+1,096% five-year return). Find your next big winner with StockStory today for free.