Electronic components and systems provider OSI Systems (NASDAQ: OSIS) reported Q4 CY2024 results exceeding the market’s revenue expectations, with sales up 12.5% year on year to $419.8 million. The company’s full-year revenue guidance of $1.70 billion at the midpoint came in 0.9% above analysts’ estimates. Its non-GAAP profit of $2.42 per share was 3.9% above analysts’ consensus estimates.
Is now the time to buy OSI Systems? Find out by accessing our full research report, it’s free.
OSI Systems (OSIS) Q4 CY2024 Highlights:
- Revenue: $419.8 million vs analyst estimates of $406.6 million (12.5% year-on-year growth, 3.2% beat)
- Adjusted EPS: $2.42 vs analyst estimates of $2.33 (3.9% beat)
- The company slightly lifted its revenue guidance for the full year to $1.70 billion at the midpoint from $1.68 billion
- Management raised its full-year Adjusted EPS guidance to $9.25 at the midpoint, a 1.1% increase
- Operating Margin: 13.8%, in line with the same quarter last year
- Backlog: $1.8 billion at quarter end
- Market Capitalization: $2.82 billion
Company Overview
With a name reflecting its initial focus on optical sensors, OSI Systems (NASDAQ: OSIS) is a designer and manufacturer of specialized electronic systems and components.
Electrical Systems
Like many equipment and component manufacturers, electrical systems companies are buoyed by secular trends such as connectivity and industrial automation. More specific pockets of strong demand include Internet of Things (IoT) connectivity and the 5G telecom upgrade cycle, which can benefit companies whose cables and conduits fit those needs. But like the broader industrials sector, these companies are also at the whim of economic cycles. Interest rates, for example, can greatly impact projects that drive demand for these products.
Sales Growth
A company’s long-term performance is an indicator of its overall quality. While any business can experience short-term success, top-performing ones enjoy sustained growth for years. Over the last five years, OSI Systems grew its sales at a mediocre 6.4% compounded annual growth rate. This fell short of our benchmark for the industrials sector, but there are still things to like about OSI Systems.
Long-term growth is the most important, but within industrials, a half-decade historical view may miss new industry trends or demand cycles. OSI Systems’s annualized revenue growth of 17.7% over the last two years is above its five-year trend, suggesting its demand recently accelerated. 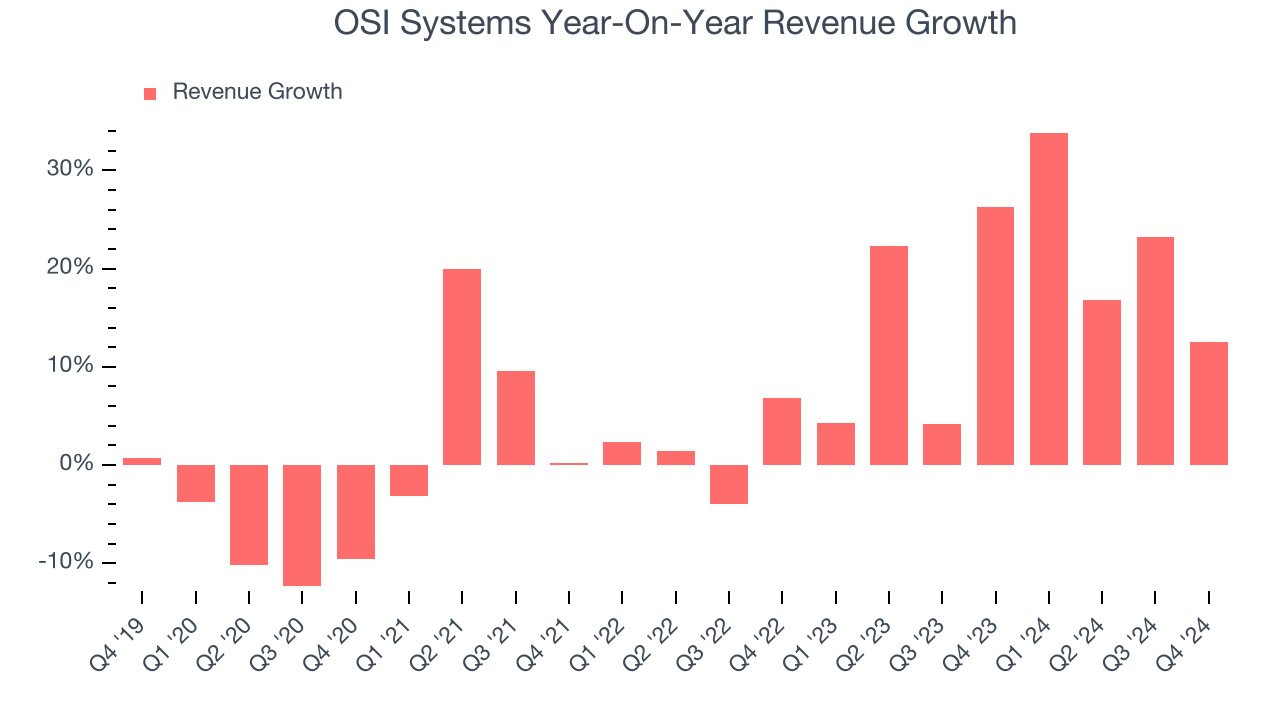
We can better understand the company’s revenue dynamics by analyzing its most important segment, Security. Over the last two years, OSI Systems’s Security revenue (inspection systems) averaged 30.5% year-on-year growth. This segment has outperformed its total sales during the same period, lifting the company’s performance.
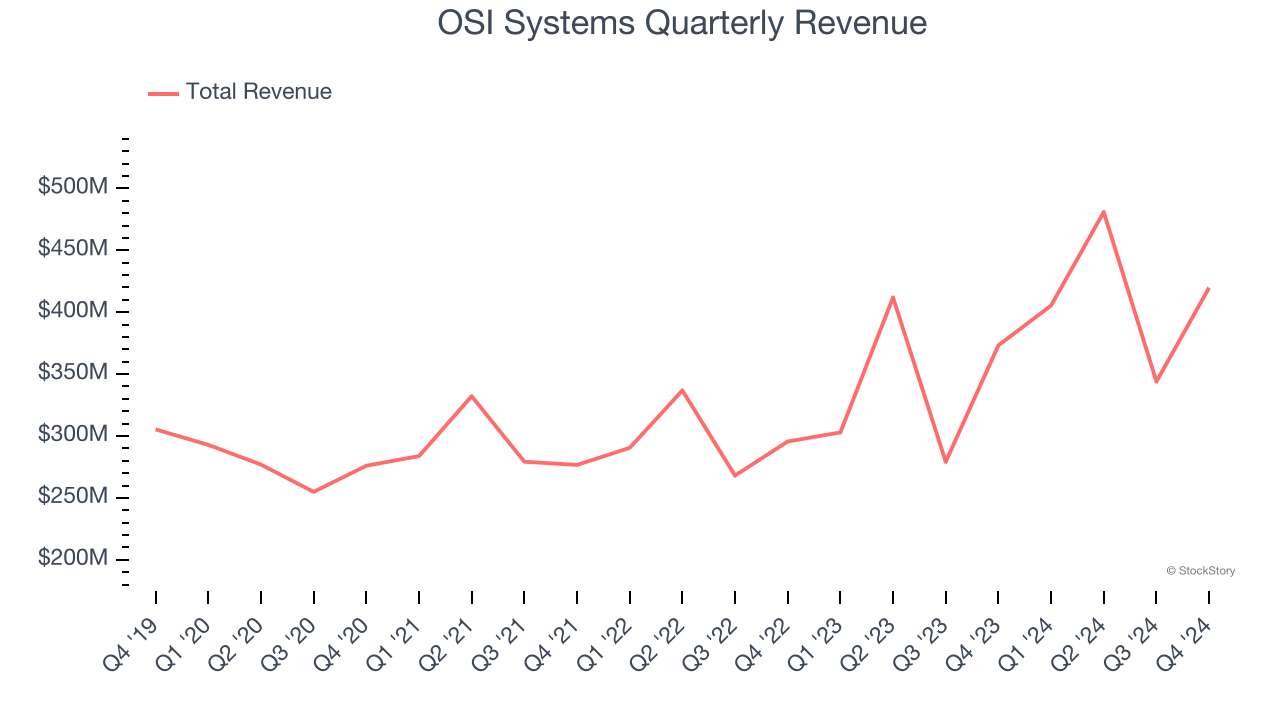
This quarter, OSI Systems reported year-on-year revenue growth of 12.5%, and its $419.8 million of revenue exceeded Wall Street’s estimates by 3.2%.
Looking ahead, sell-side analysts expect revenue to grow 5.1% over the next 12 months, a deceleration versus the last two years. This projection is underwhelming and implies its products and services will see some demand headwinds. At least the company is tracking well in other measures of financial health.
Unless you’ve been living under a rock, it should be obvious by now that generative AI is going to have a huge impact on how large corporations do business. While Nvidia and AMD are trading close to all-time highs, we prefer a lesser-known (but still profitable) stock benefiting from the rise of AI. Click here to access our free report one of our favorites growth stories.
Operating Margin
OSI Systems has managed its cost base well over the last five years. It demonstrated solid profitability for an industrials business, producing an average operating margin of 10.8%. This result isn’t too surprising as its gross margin gives it a favorable starting point.
Looking at the trend in its profitability, OSI Systems’s operating margin rose by 3.5 percentage points over the last five years, showing its efficiency has improved.
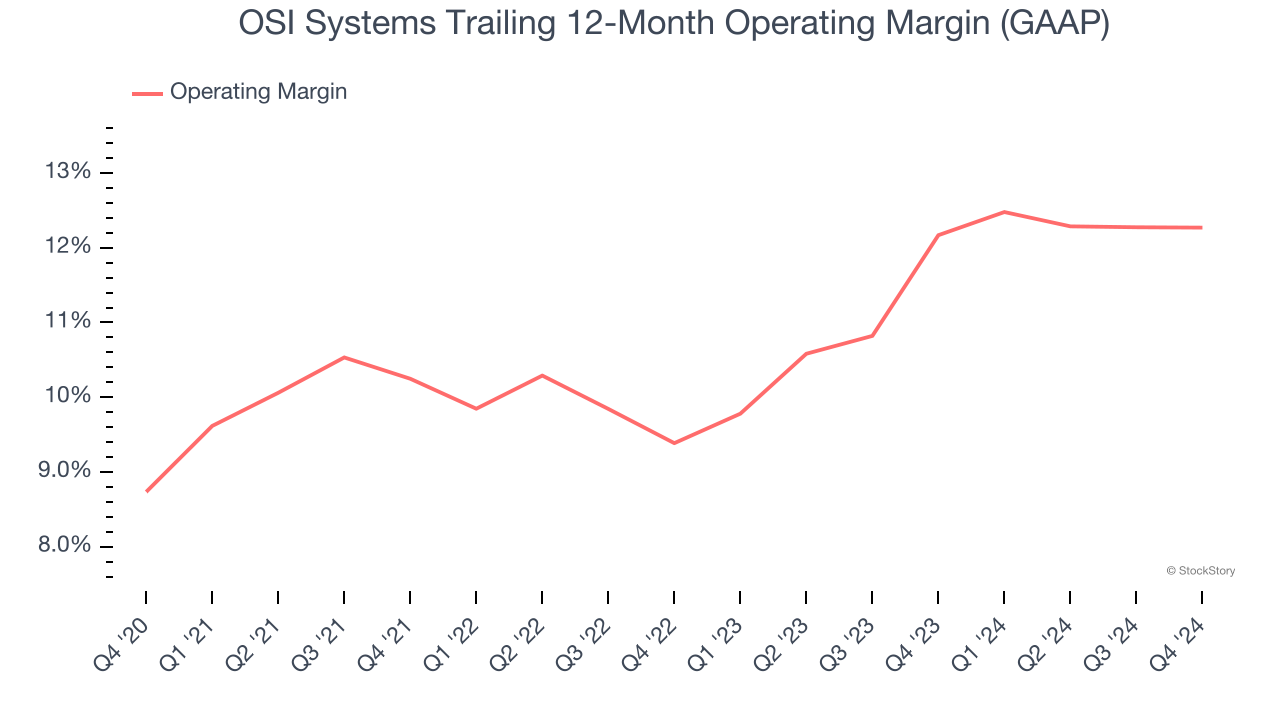
In Q4, OSI Systems generated an operating profit margin of 13.8%, in line with the same quarter last year. This indicates the company’s cost structure has recently been stable.
Earnings Per Share
Revenue trends explain a company’s historical growth, but the long-term change in earnings per share (EPS) points to the profitability of that growth – for example, a company could inflate its sales through excessive spending on advertising and promotions.
OSI Systems’s EPS grew at a remarkable 14% compounded annual growth rate over the last five years, higher than its 6.4% annualized revenue growth. This tells us the company became more profitable on a per-share basis as it expanded.
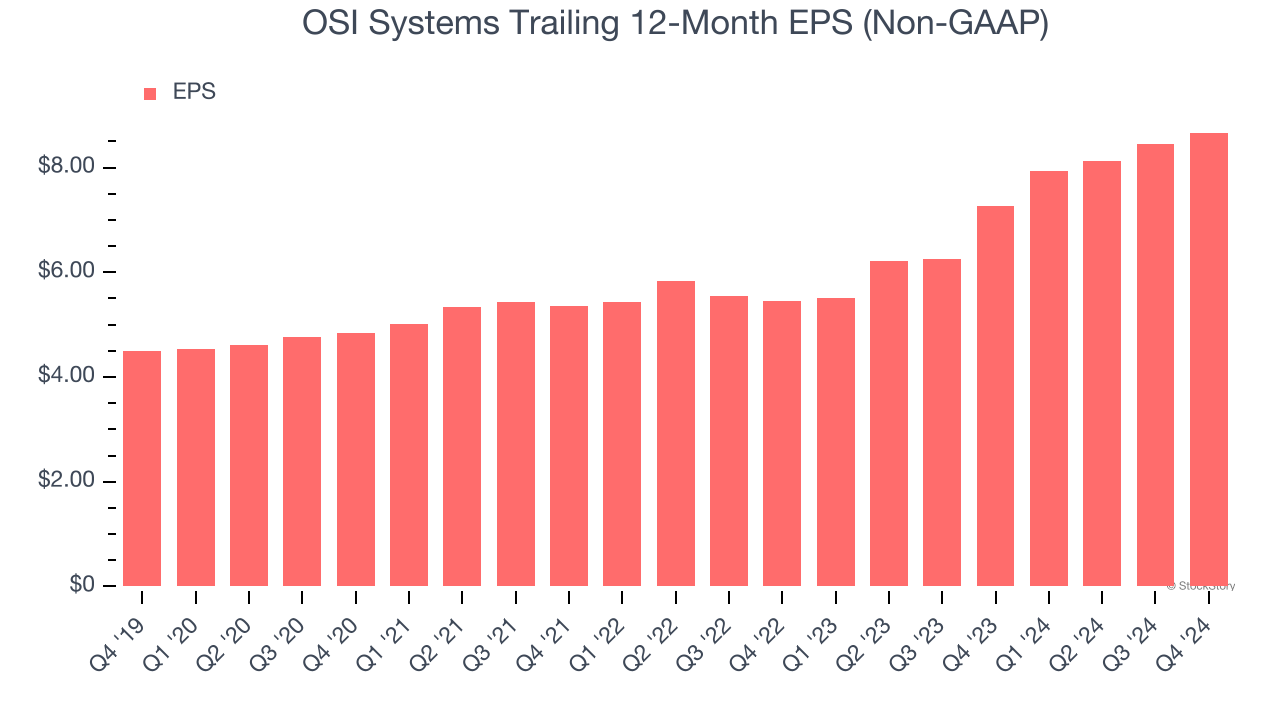
Diving into the nuances of OSI Systems’s earnings can give us a better understanding of its performance. As we mentioned earlier, OSI Systems’s operating margin was flat this quarter but expanded by 3.5 percentage points over the last five years. On top of that, its share count shrank by 8.8%. These are positive signs for shareholders because improving profitability and share buybacks turbocharge EPS growth relative to revenue growth. 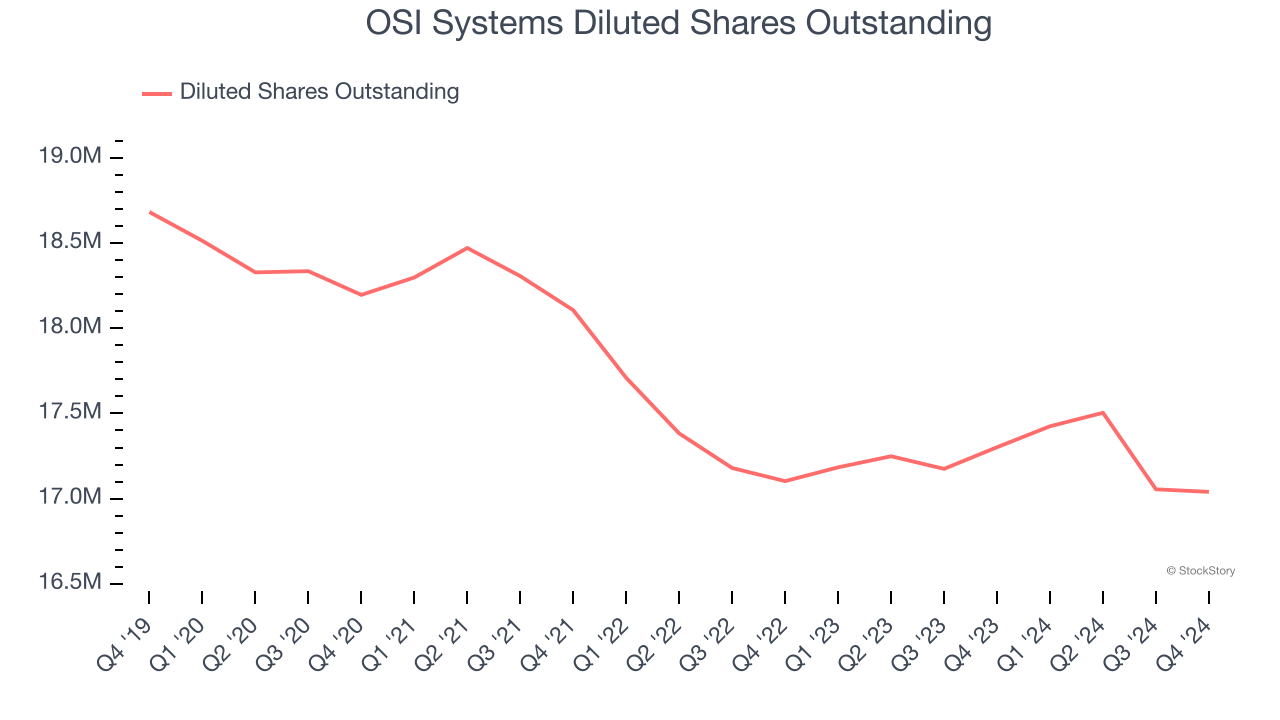
Like with revenue, we analyze EPS over a more recent period because it can provide insight into an emerging theme or development for the business.
For OSI Systems, its two-year annual EPS growth of 26% was higher than its five-year trend. We love it when earnings growth accelerates, especially when it accelerates off an already high base.
In Q4, OSI Systems reported EPS at $2.42, up from $2.21 in the same quarter last year. This print beat analysts’ estimates by 3.9%. Over the next 12 months, Wall Street expects OSI Systems’s full-year EPS of $8.67 to grow 7.6%.
Key Takeaways from OSI Systems’s Q4 Results
It was great to see OSI Systems beat analysts’ revenue and EPS expectations this quarter due to strong outperformance in its Security segment. We were also glad it raised its full-year revenue and EPS guidance. Overall, we think this was a solid "beat-and-raise" quarter with some key metrics above expectations. The stock traded up 2.4% to $173 immediately after reporting.
Indeed, OSI Systems had a rock-solid quarterly earnings result, but is this stock a good investment here? When making that decision, it’s important to consider its valuation, business qualities, as well as what has happened in the latest quarter. We cover that in our actionable full research report which you can read here, it’s free.