Over the last six months, Novanta’s shares have sunk to $149.65, producing a disappointing 17.7% loss - a stark contrast to the S&P 500’s 12.6% gain. This was partly driven by its softer quarterly results and may have investors wondering how to approach the situation.
Is there a buying opportunity in Novanta, or does it present a risk to your portfolio? Get the full breakdown from our expert analysts, it’s free.
Despite the more favorable entry price, we're swiping left on Novanta for now. Here are three reasons why you should be careful with NOVT and a stock we'd rather own.
Why Is Novanta Not Exciting?
Originally a pioneer in the laser scanning industry during the late 1960s, Novanta (NASDAQ: NOVT) offers medicine and manufacturing technology to the medical, life sciences, and manufacturing industries.
1. Lackluster Revenue Growth
Long-term growth is the most important, but within industrials, a stretched historical view may miss new industry trends or demand cycles. Novanta’s recent history shows its demand slowed as its annualized revenue growth of 4.7% over the last two years is below its five-year trend. 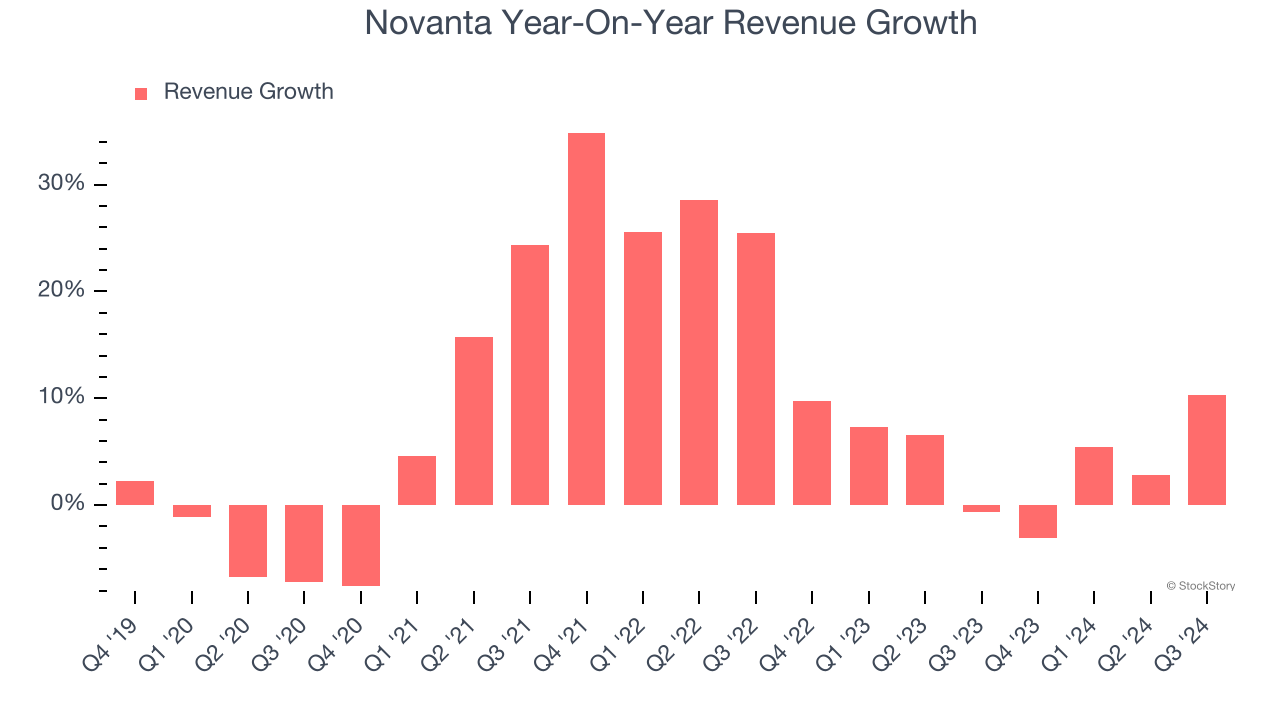
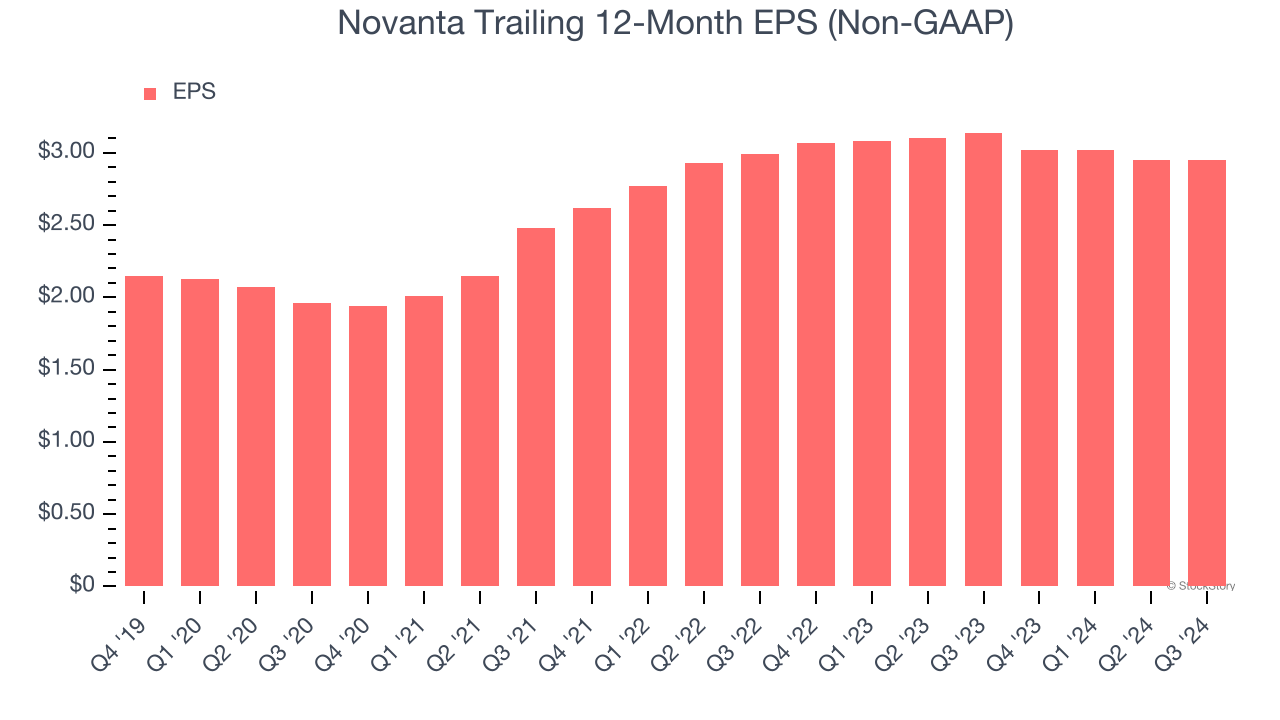
2. EPS Barely Growing
Analyzing the long-term change in earnings per share (EPS) shows whether a company's incremental sales were profitable – for example, revenue could be inflated through excessive spending on advertising and promotions.
Novanta’s unimpressive 7.7% annual EPS growth over the last five years aligns with its revenue performance. On the bright side, this tells us its incremental sales were profitable.
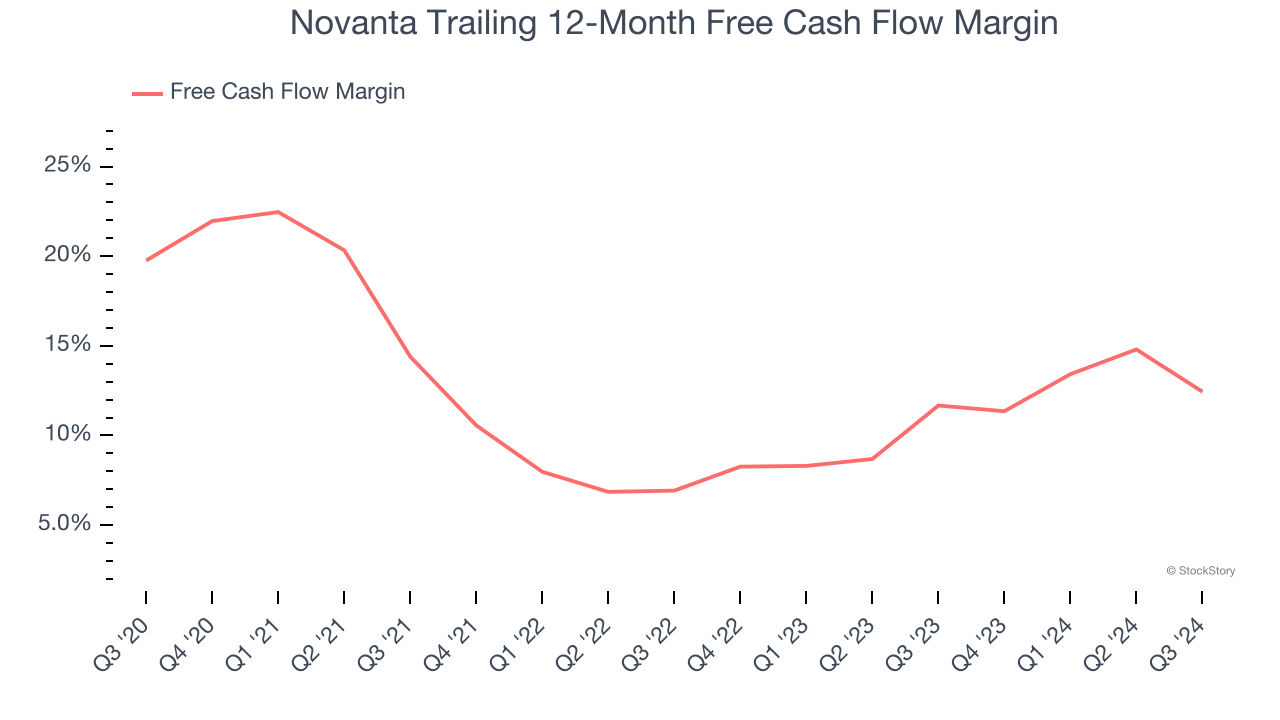
3. Free Cash Flow Margin Dropping
If you’ve followed StockStory for a while, you know we emphasize free cash flow. Why, you ask? We believe that in the end, cash is king, and you can’t use accounting profits to pay the bills.
As you can see below, Novanta’s margin dropped by 7.3 percentage points over the last five years. If its declines continue, it could signal higher capital intensity. Novanta’s free cash flow margin for the trailing 12 months was 12.4%.
Final Judgment
Novanta isn’t a terrible business, but it isn’t one of our picks. Following the recent decline, the stock trades at 87.8× forward EV-to-EBITDA (or $149.65 per share). This valuation tells us a lot of optimism is priced in - we think there are better opportunities elsewhere. We’d suggest looking at our favorite picks and shovels play for semiconductor manufacturing.
Stocks We Like More Than Novanta
With rates dropping, inflation stabilizing, and the elections in the rearview mirror, all signs point to the start of a new bull run - and we’re laser-focused on finding the best stocks for this upcoming cycle.
Put yourself in the driver’s seat by checking out our Top 5 Growth Stocks for this month. This is a curated list of our High Quality stocks that have generated a market-beating return of 175% over the last five years.
Stocks that made our list in 2019 include now familiar names such as Nvidia (+2,183% between December 2019 and December 2024) as well as under-the-radar businesses like Sterling Infrastructure (+1,096% five-year return). Find your next big winner with StockStory today for free.