
Over the last six months, PlayStudios’s shares have sunk to $1.96, producing a disappointing 5.3% loss - a stark contrast to the S&P 500’s 9.4% gain. This might have investors contemplating their next move.
Is now the time to buy PlayStudios, or should you be careful about including it in your portfolio? Get the full stock story straight from our expert analysts, it’s free.
Even with the cheaper entry price, we're swiping left on PlayStudios for now. Here are three reasons why you should be careful with MYPS and a stock we'd rather own.
Why Do We Think PlayStudios Will Underperform?
Founded by a team of former gaming industry executives, PlayStudios (NASDAQ: MYPS) offers free-to-play digital casino games.
1. Long-Term Revenue Growth Disappoints
A company’s long-term sales performance signals its overall quality. Even a bad business can shine for one or two quarters, but a top-tier one grows for years. Over the last four years, PlayStudios grew its sales at a sluggish 3.3% compounded annual growth rate. This fell short of our benchmark for the consumer discretionary sector. 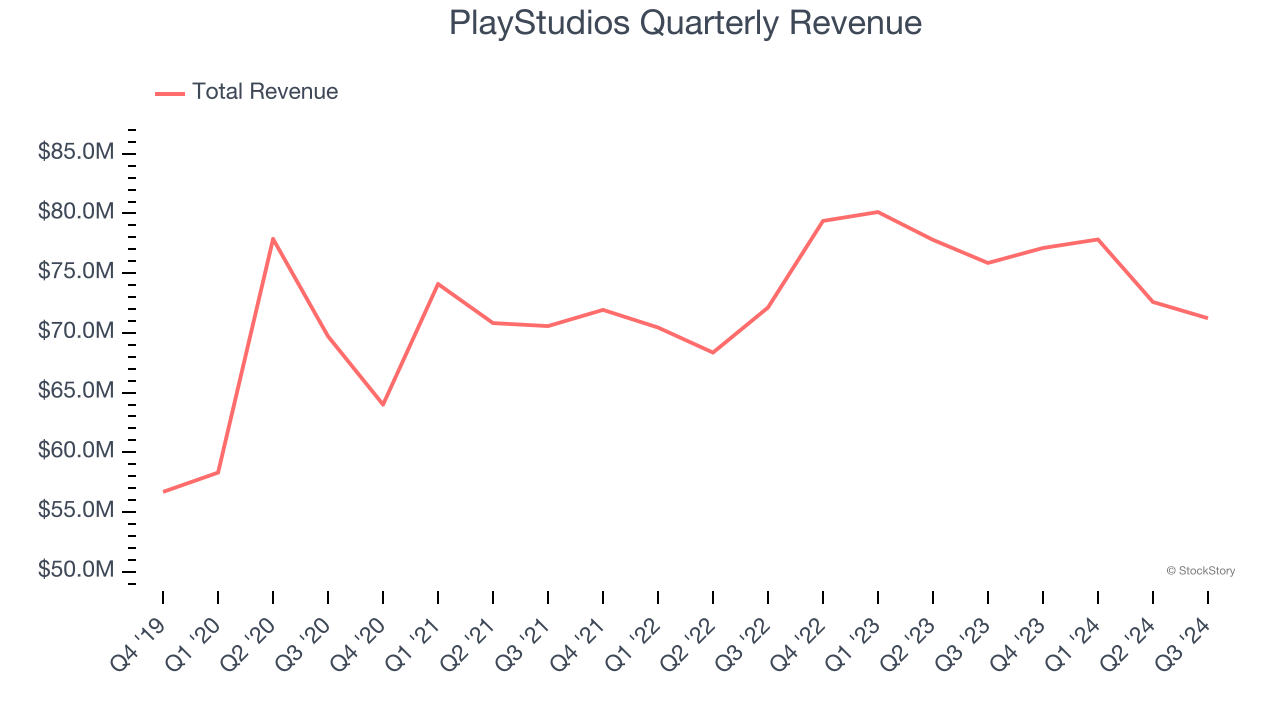
2. EPS Trending Down
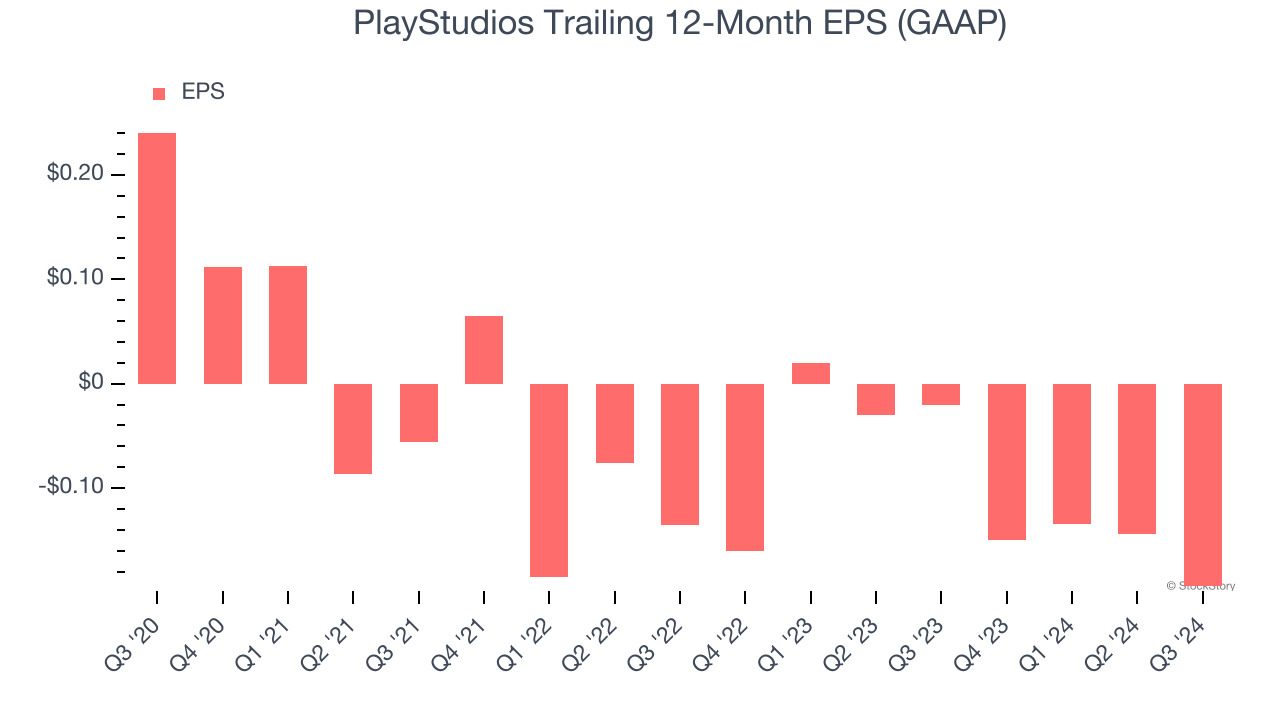
We track the long-term change in earnings per share (EPS) because it highlights whether a company’s growth is profitable.
Sadly for PlayStudios, its EPS declined by 29.4% annually over the last four years while its revenue grew by 3.3%. This tells us the company became less profitable on a per-share basis as it expanded.
3. High Debt Levels Increase Risk
Debt is a tool that can boost company returns but presents risks if used irresponsibly. As long-term investors, we aim to avoid companies taking excessive advantage of this instrument because it could lead to insolvency.
PlayStudios’s $11 billion of debt exceeds the $105.2 million of cash on its balance sheet. Furthermore, its 185× net-debt-to-EBITDA ratio (based on its EBITDA of $58.8 million over the last 12 months) shows the company is overleveraged.
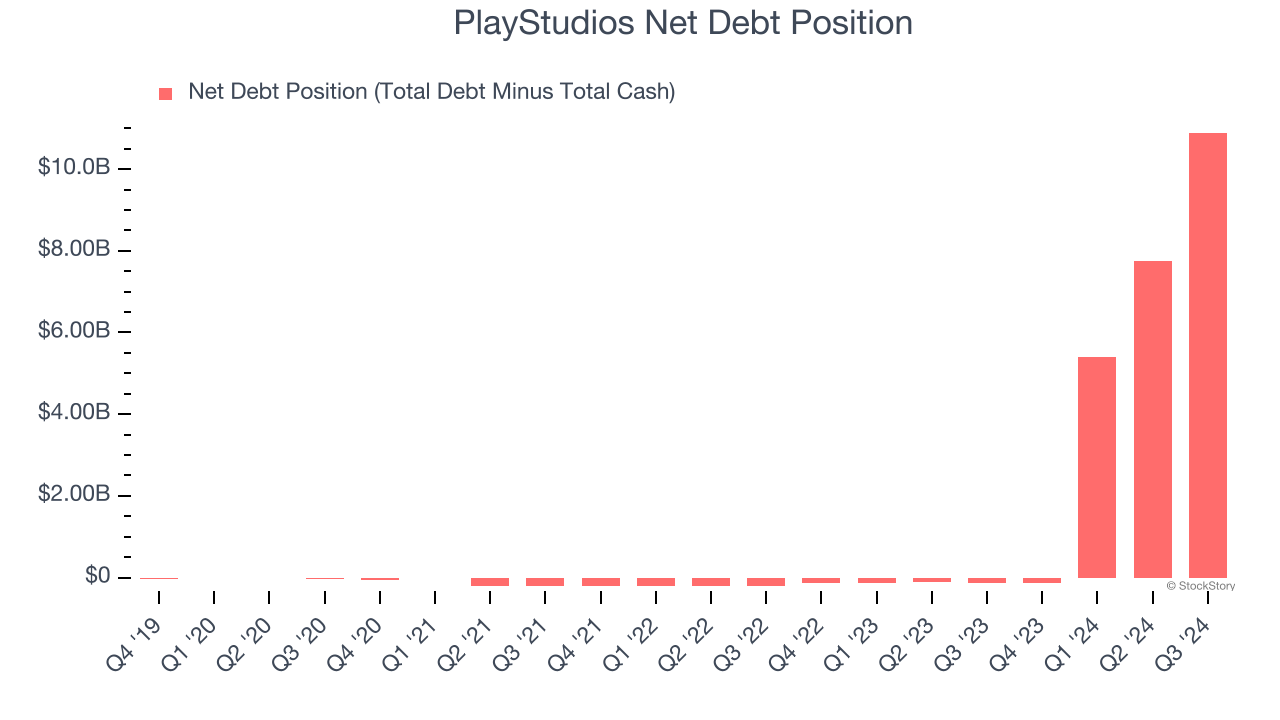
At this level of debt, incremental borrowing becomes increasingly expensive and credit agencies could downgrade the company’s rating if profitability falls. PlayStudios could also be backed into a corner if the market turns unexpectedly – a situation we seek to avoid as investors in high-quality companies.
We hope PlayStudios can improve its balance sheet and remain cautious until it increases its profitability or pays down its debt.
Final Judgment
PlayStudios falls short of our quality standards. After the recent drawdown, the stock trades at 3.8× forward EV-to-EBITDA (or $1.96 per share). While this valuation is reasonable, we don’t see a big opportunity at the moment. There are superior stocks to buy right now. We’d recommend looking at an all-weather company that owns household favorite Taco Bell.
Stocks We Would Buy Instead of PlayStudios
The Trump trade may have passed, but rates are still dropping and inflation is still cooling. Opportunities are ripe for those ready to act - and we’re here to help you pick them.
Get started by checking out our Top 6 Stocks for this week. This is a curated list of our High Quality stocks that have generated a market-beating return of 175% over the last five years.
Stocks that made our list in 2019 include now familiar names such as Nvidia (+2,183% between December 2019 and December 2024) as well as under-the-radar businesses like Sterling Infrastructure (+1,096% five-year return). Find your next big winner with StockStory today for free.


