
Over the last six months, Campbell’s shares have sunk to $39.79, producing a disappointing 15.3% loss - a stark contrast to the S&P 500’s 11.1% gain. This may have investors wondering how to approach the situation.
Is there a buying opportunity in Campbell's, or does it present a risk to your portfolio? See what our analysts have to say in our full research report, it’s free.
Even though the stock has become cheaper, we're sitting this one out for now. Here are three reasons why there are better opportunities than CPB and a stock we'd rather own.
Why Is Campbell's Not Exciting?
With its iconic canned soup as its cornerstone product, Campbell's (NASDAQ: CPB) is a packaged food company with an illustrious portfolio of brands.
1. Demand Slipping as Sales Volumes Decline
Revenue growth can be broken down into changes in price and volume (the number of units sold). While both are important, volume is the lifeblood of a successful staples business as there’s a ceiling to what consumers will pay for everyday goods; they can always trade down to non-branded products if the branded versions are too expensive.
Campbell’s average quarterly sales volumes have shrunk by 2.5% over the last two years. This decrease isn’t ideal because the quantity demanded for consumer staples products is typically stable. 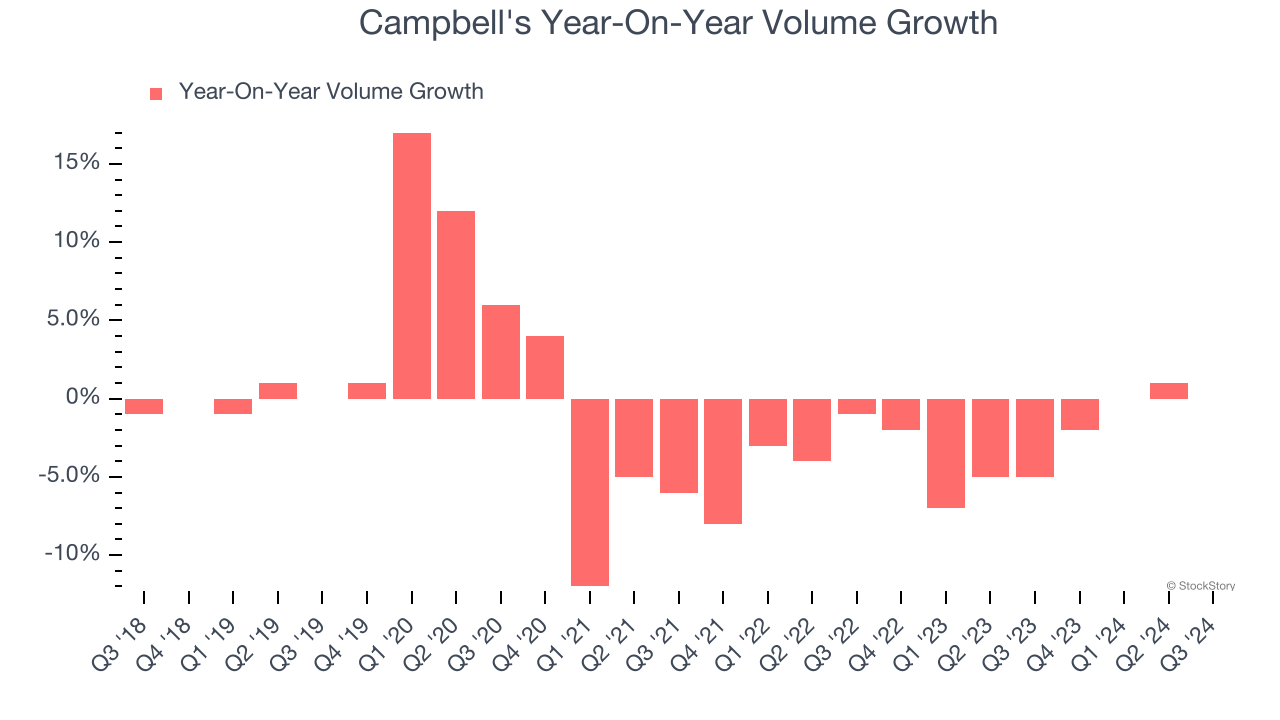
2. Slow Organic Growth Suggests Waning Demand In Core Business
When analyzing revenue growth, we care most about organic revenue growth. This metric captures a business’s performance excluding one-time events such as mergers, acquisitions, and divestitures as well as foreign currency fluctuations.
The demand for Campbell’s products has been stable over the last eight quarters but fell behind the broader sector. On average, the company has posted feeble year-on-year organic revenue growth of 2.4%. 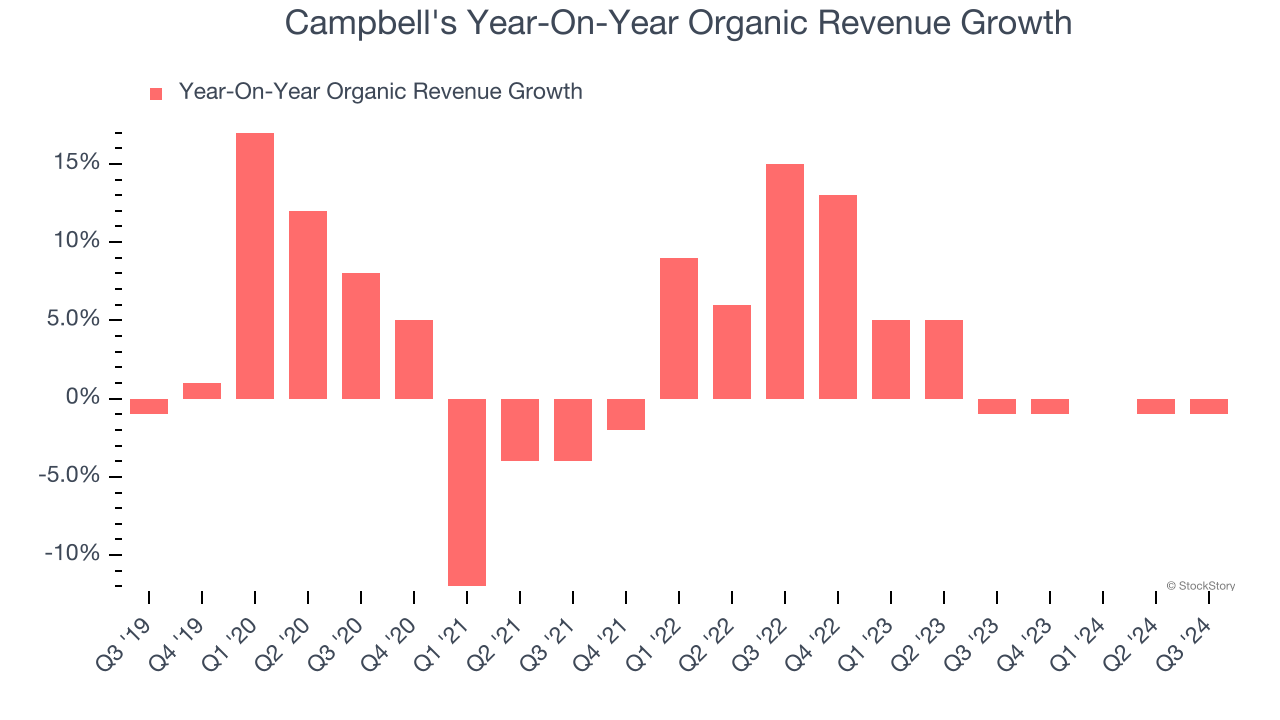
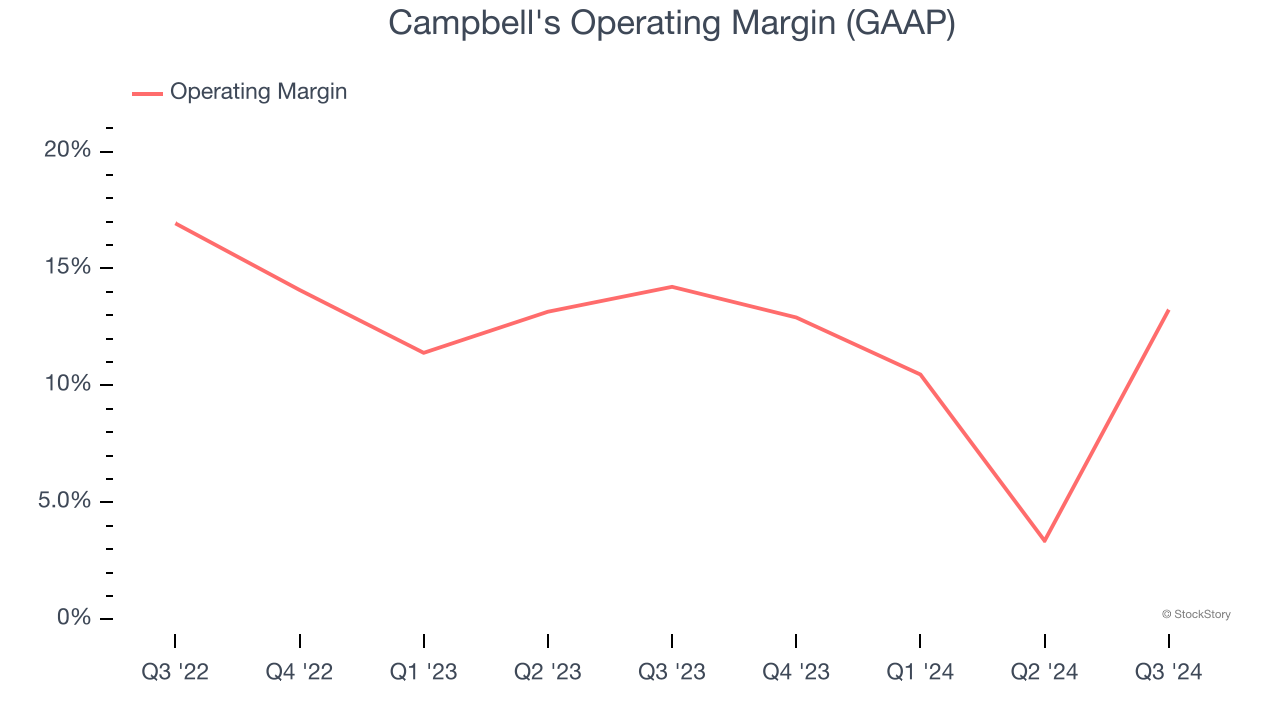
3. Operating Margin Falling
Operating margin is a key measure of profitability. Think of it as net income - the bottom line - excluding the impact of taxes and interest on debt, which are less connected to business fundamentals.
Analyzing the trend in its profitability, Campbell’s operating margin decreased by 3.1 percentage points over the last year. Even though its historical margin is high, shareholders will want to see Campbell's become more profitable in the future. Its operating margin for the trailing 12 months was 10.2%.
Final Judgment
Campbell's isn’t a terrible business, but it doesn’t pass our quality test. Following the recent decline, the stock trades at 12.1× forward price-to-earnings (or $39.79 per share). While this valuation is fair, the upside isn’t great compared to the potential downside. We're fairly confident there are better stocks to buy right now. We’d suggest looking at the Amazon and PayPal of Latin America.
Stocks We Would Buy Instead of Campbell's
The Trump trade may have passed, but rates are still dropping and inflation is still cooling. Opportunities are ripe for those ready to act - and we’re here to help you pick them.
Get started by checking out our Top 5 Strong Momentum Stocks for this week. This is a curated list of our High Quality stocks that have generated a market-beating return of 175% over the last five years.
Stocks that made our list in 2019 include now familiar names such as Nvidia (+2,183% between December 2019 and December 2024) as well as under-the-radar businesses like Comfort Systems (+751% five-year return). Find your next big winner with StockStory today for free.


