Freight delivery company Landstar (NASDAQ: LSTR) reported Q4 CY2024 results topping the market’s revenue expectations, but sales were flat year on year at $1.21 billion. Its GAAP profit of $1.31 per share was 2.5% below analysts’ consensus estimates.
Is now the time to buy Landstar? Find out by accessing our full research report, it’s free.
Landstar (LSTR) Q4 CY2024 Highlights:
- Revenue: $1.21 billion vs analyst estimates of $1.2 billion (flat year on year, 0.8% beat)
- EPS (GAAP): $1.31 vs analyst expectations of $1.34 (2.5% miss)
- Operating Margin: 4.8%, down from 6.2% in the same quarter last year
- Market Capitalization: $6.22 billion
Company Overview
Covering billions of miles throughout North America, Landstar (NASDAQ: LSTR) is a transportation company specializing in freight and last-mile delivery services.
Ground Transportation
The growth of e-commerce and global trade continues to drive demand for shipping services, especially last-mile delivery, presenting opportunities for ground transportation companies. The industry continues to invest in data, analytics, and autonomous fleets to optimize efficiency and find the most cost-effective routes. Despite the essential services this industry provides, ground transportation companies are still at the whim of economic cycles. Consumer spending, for example, can greatly impact the demand for these companies’ offerings while fuel costs can influence profit margins.
Sales Growth
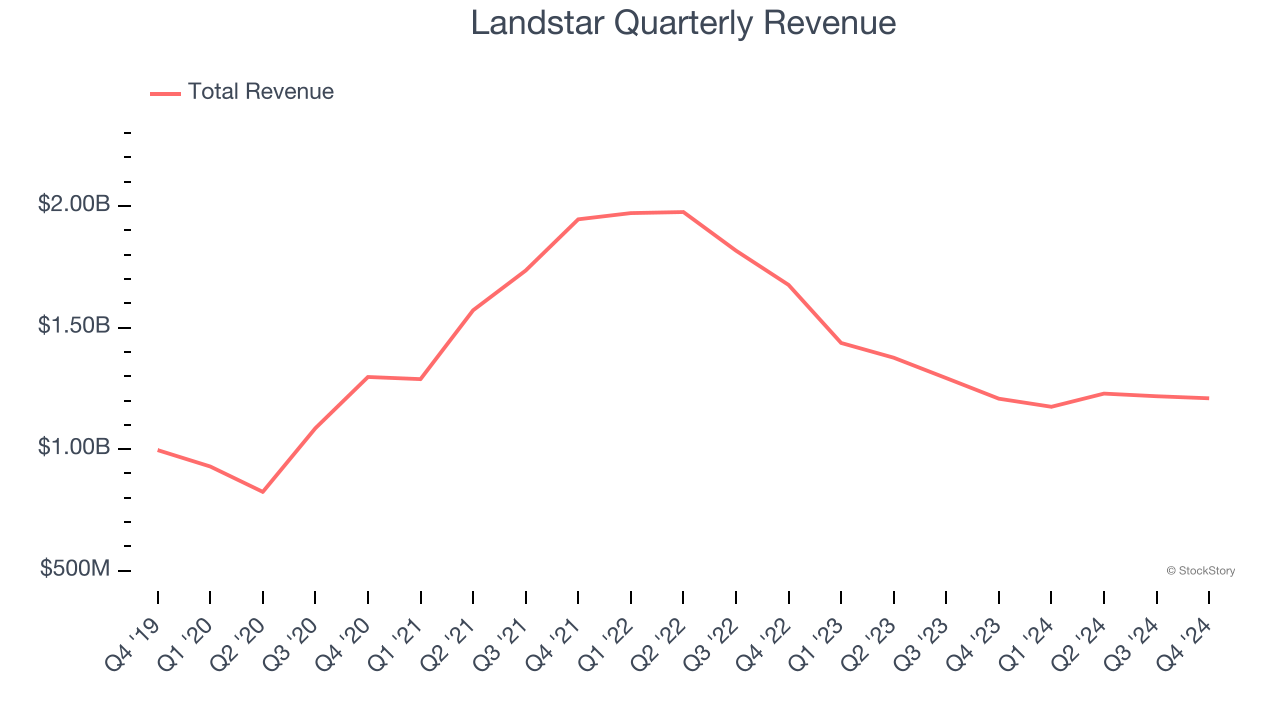
A company’s long-term sales performance signals its overall quality. Even a bad business can shine for one or two quarters, but a top-tier one grows for years. Over the last five years, Landstar grew its sales at a sluggish 3.4% compounded annual growth rate. This fell short of our benchmark for the industrials sector and is a tough starting point for our analysis.
We at StockStory place the most emphasis on long-term growth, but within industrials, a half-decade historical view may miss cycles, industry trends, or a company capitalizing on catalysts such as a new contract win or a successful product line. Landstar’s history shows it grew in the past but relinquished its gains over the last two years, as its revenue fell by 19.4% annually. Landstar isn’t alone in its struggles as the Ground Transportation industry experienced a cyclical downturn, with many similar businesses observing lower sales at this time. 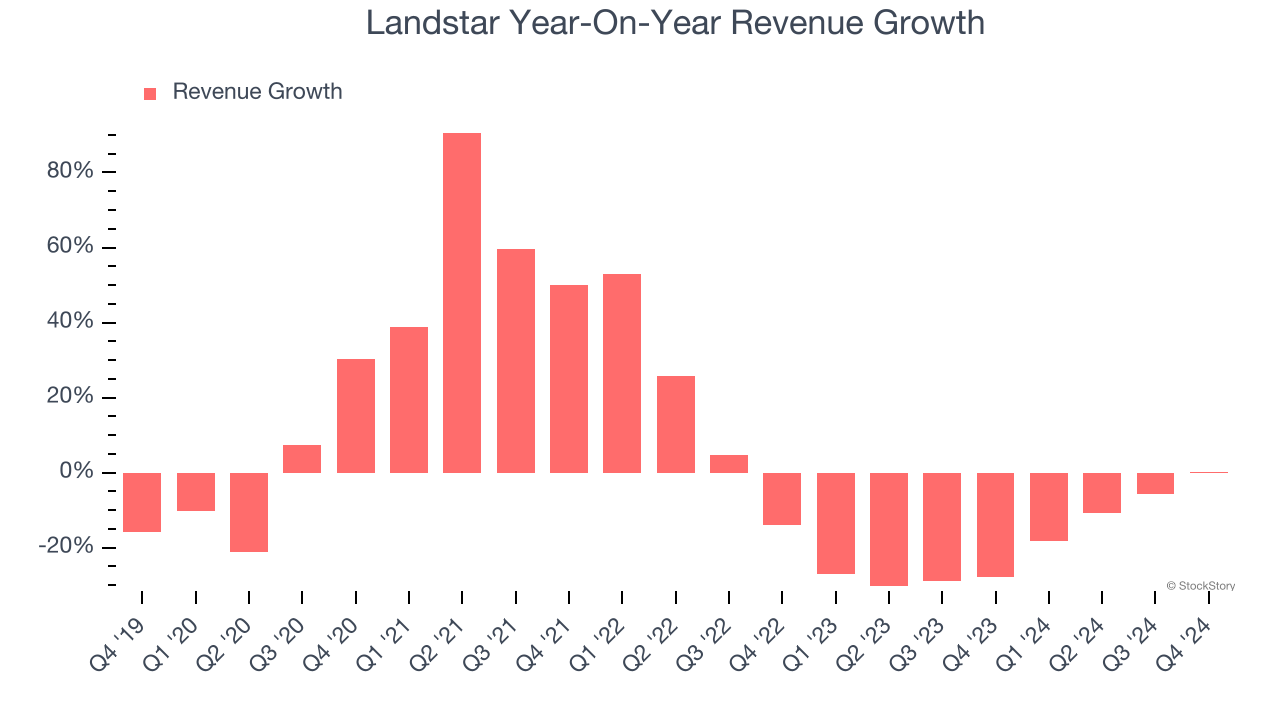
We can better understand the company’s revenue dynamics by analyzing its most important segments, Van Equipment and Platform Equipment, which are 49.3% and 29.9% of revenue. Over the last two years, Landstar’s Van Equipment revenue (full truckload van transportation) averaged 19.9% year-on-year declines while its Platform Equipment revenue (full truckload trailer transportation) averaged 8.6% declines.
This quarter, Landstar’s $1.21 billion of revenue was flat year on year but beat Wall Street’s estimates by 0.8%.
Looking ahead, sell-side analysts expect revenue to grow 7.8% over the next 12 months, an improvement versus the last two years. This projection is above average for the sector and suggests its newer products and services will fuel better top-line performance.
Unless you’ve been living under a rock, it should be obvious by now that generative AI is going to have a huge impact on how large corporations do business. While Nvidia and AMD are trading close to all-time highs, we prefer a lesser-known (but still profitable) stock benefiting from the rise of AI. Click here to access our free report one of our favorites growth stories.
Operating Margin
Landstar was profitable over the last five years but held back by its large cost base. Its average operating margin of 6.8% was weak for an industrials business. This result isn’t too surprising given its low gross margin as a starting point.
Analyzing the trend in its profitability, Landstar’s operating margin might have seen some fluctuations but has generally stayed the same over the last five years, which doesn’t help its cause.
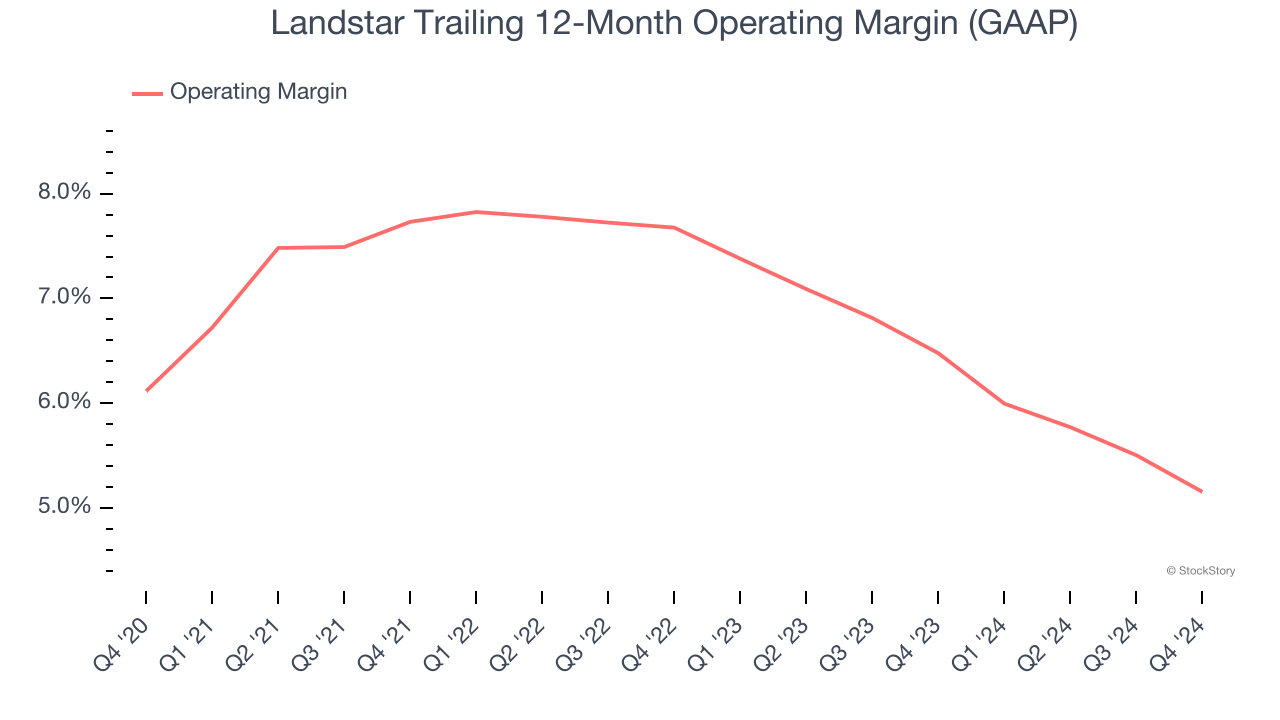
This quarter, Landstar generated an operating profit margin of 4.8%, down 1.4 percentage points year on year. Since Landstar’s operating margin decreased more than its gross margin, we can assume it was recently less efficient because expenses such as marketing, R&D, and administrative overhead increased.
Earnings Per Share
Revenue trends explain a company’s historical growth, but the long-term change in earnings per share (EPS) points to the profitability of that growth – for example, a company could inflate its sales through excessive spending on advertising and promotions.
Landstar’s flat EPS over the last five years was below its 3.4% annualized revenue growth. However, its operating margin didn’t change during this timeframe, telling us that non-fundamental factors such as interest and taxes affected its ultimate earnings.
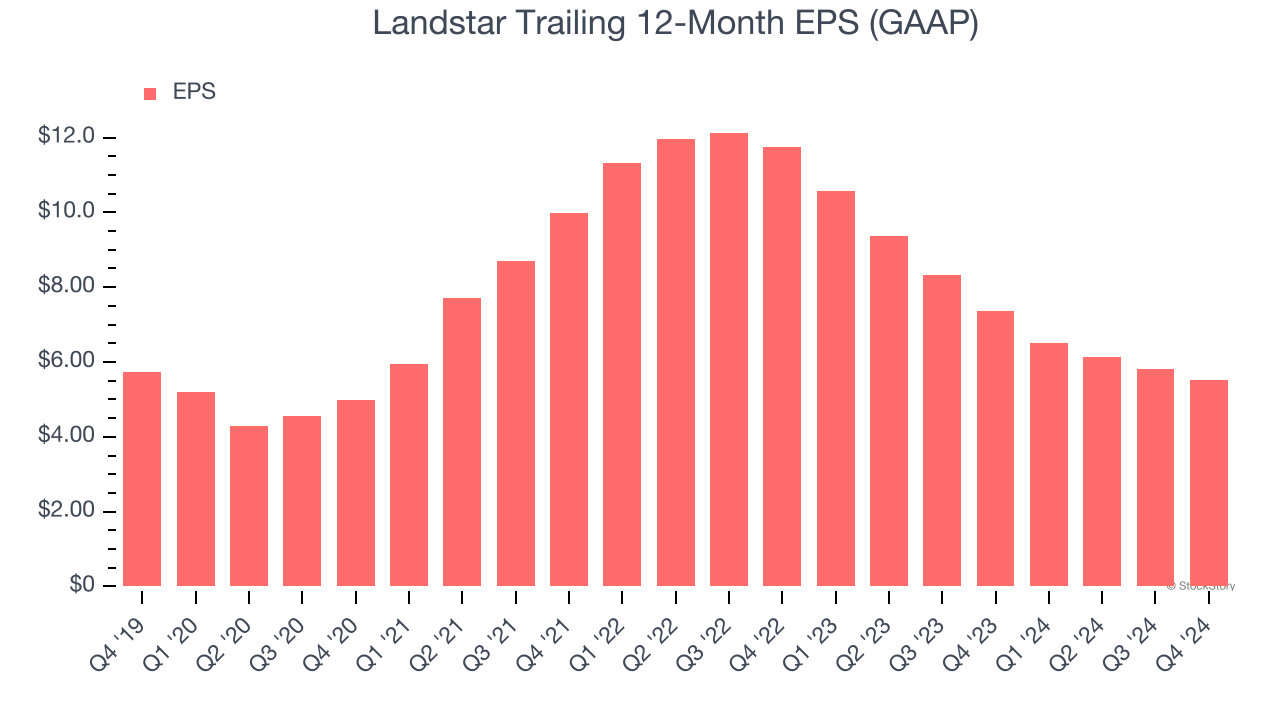
Like with revenue, we analyze EPS over a shorter period to see if we are missing a change in the business.
For Landstar, its two-year annual EPS declines of 31.5% show its recent history was to blame for its underperformance over the last five years. These results were bad no matter how you slice the data.
In Q4, Landstar reported EPS at $1.31, down from $1.62 in the same quarter last year. This print missed analysts’ estimates. Over the next 12 months, Wall Street expects Landstar’s full-year EPS of $5.52 to grow 18.1%.
Key Takeaways from Landstar’s Q4 Results
It was good to see Landstar narrowly top analysts’ revenue expectations this quarter. On the other hand, its EPS missed. Overall, this quarter could have been better. The stock traded down 3.4% to $167.11 immediately after reporting.
Landstar didn’t show it’s best hand this quarter, but does that create an opportunity to buy the stock right now? If you’re making that decision, you should consider the bigger picture of valuation, business qualities, as well as the latest earnings. We cover that in our actionable full research report which you can read here, it’s free.