ETFOptimize | High-performance ETF-based Investment Strategies

Quantitative strategies, Wall Street-caliber research, and insightful market analysis since 1998.


ETFOptimize | HOME
Close Window

2 Reasons to Sell SXI and 1 Stock to Buy Instead

SXI Cover Image

Standex has had an impressive run over the past six months as its shares have beaten the S&P 500 by 11.9%. The stock now trades at $186.01, marking a 18.2% gain. This run-up might have investors contemplating their next move.

Is there a buying opportunity in Standex, or does it present a risk to your portfolio? Dive into our full research report to see our analyst team’s opinion, it’s free.

Despite the momentum, we're swiping left on Standex for now. Here are two reasons why we avoid SXI and a stock we'd rather own.

Why Is Standex Not Exciting?

Holding over 500 patents globally, Standex (NYSE: SXI) is a manufacturer and distributor of industrial components for various sectors.

1. Long-Term Revenue Growth Disappoints

Reviewing a company’s long-term sales performance reveals insights into its quality. Any business can have short-term success, but a top-tier one grows for years. Unfortunately, Standex’s 3.2% annualized revenue growth over the last five years was sluggish. This fell short of our benchmark for the industrials sector. Standex Quarterly Revenue

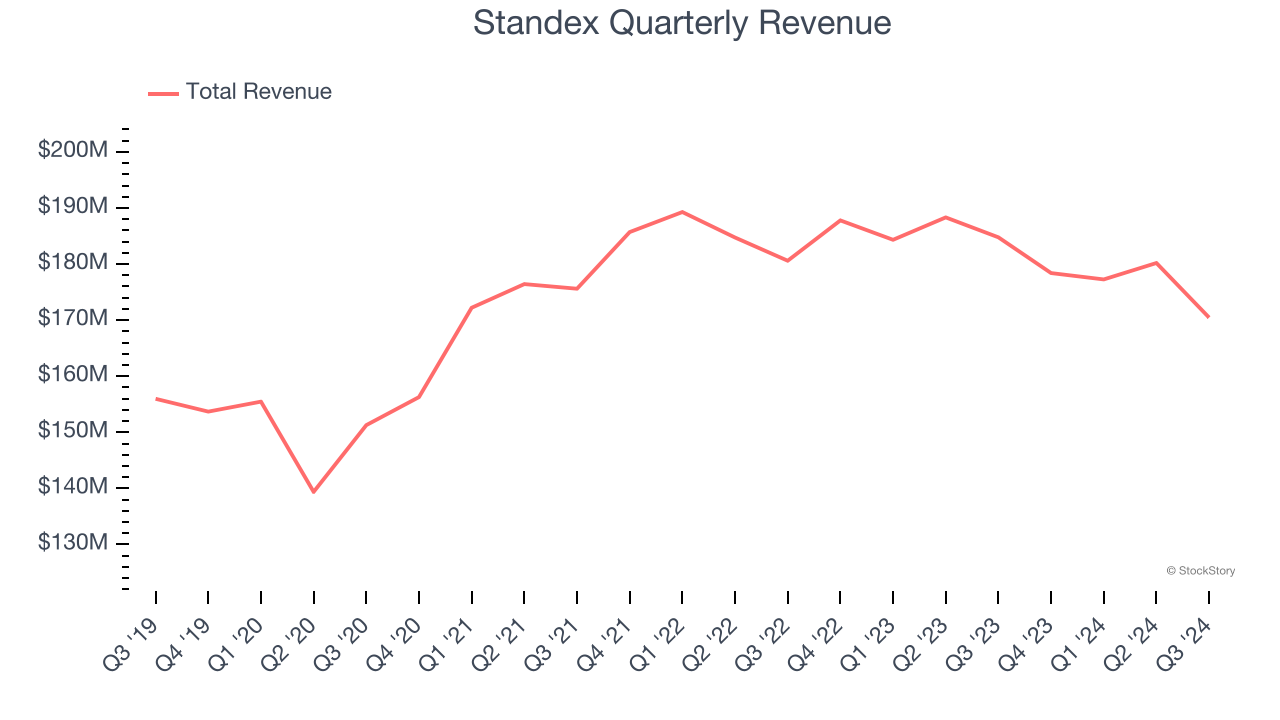
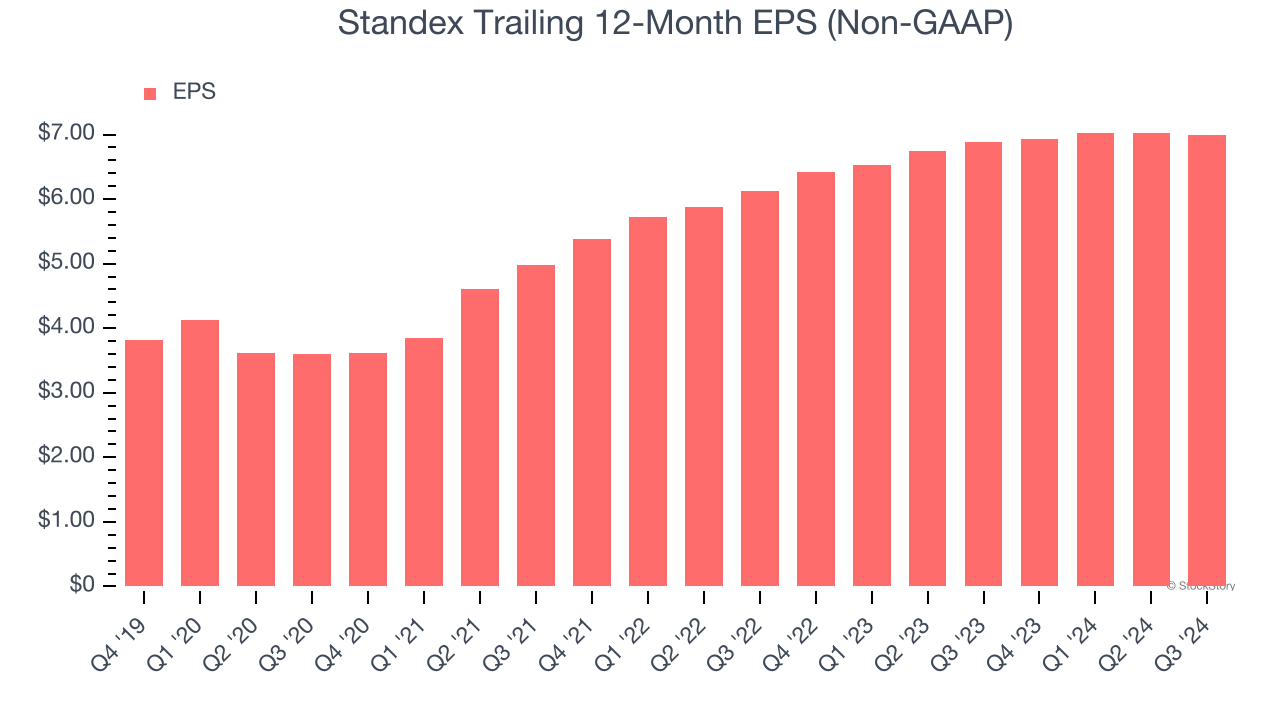
2. Recent EPS Growth Below Our Standards

Although long-term earnings trends give us the big picture, we like to analyze EPS over a shorter period to see if we are missing a change in the business.

Standex’s EPS grew at an unimpressive 6.9% compounded annual growth rate over the last two years. On the bright side, this performance was higher than its 2.3% annualized revenue declines and tells us management adapted its cost structure in response to a challenging demand environment.

Standex Trailing 12-Month EPS (Non-GAAP)

Final Judgment

Standex’s business quality ultimately falls short of our standards. With its shares outperforming the market lately, the stock trades at 24.1× forward price-to-earnings (or $186.01 per share). This multiple tells us a lot of good news is priced in - you can find better investment opportunities elsewhere. We’d recommend looking at TransDigm, a dominant Aerospace business that has perfected its M&A strategy.

Stocks We Would Buy Instead of Standex

With rates dropping, inflation stabilizing, and the elections in the rearview mirror, all signs point to the start of a new bull run - and we’re laser-focused on finding the best stocks for this upcoming cycle.

Put yourself in the driver’s seat by checking out our Top 6 Stocks for this week. This is a curated list of our High Quality stocks that have generated a market-beating return of 175% over the last five years.

Stocks that made our list in 2019 include now familiar names such as Nvidia (+2,691% between September 2019 and September 2024) as well as under-the-radar businesses like Comfort Systems (+783% five-year return). Find your next big winner with StockStory today for free.

Recent Quotes

View More
Symbol Price Change (%)
AMZN  213.04
-1.43 (-0.67%)
AAPL  252.29
+4.84 (1.96%)
AMD  233.08
-1.48 (-0.63%)
BAC  51.28
+0.84 (1.67%)
GOOG  253.79
+1.91 (0.76%)
META  716.91
+4.84 (0.68%)
MSFT  513.58
+1.97 (0.39%)
NVDA  183.16
+1.35 (0.74%)
ORCL  291.31
-21.69 (-6.93%)
TSLA  439.31
+10.56 (2.46%)
Stock Quote API & Stock News API supplied by www.cloudquote.io
Quotes delayed at least 20 minutes.
By accessing this page, you agree to the Privacy Policy and Terms Of Service.


IntelligentValue Home
Close Window

DISCLAIMER

All content herein is issued solely for informational purposes and is not to be construed as an offer to sell or the solicitation of an offer to buy, nor should it be interpreted as a recommendation to buy, hold or sell (short or otherwise) any security.  All opinions, analyses, and information included herein are based on sources believed to be reliable, but no representation or warranty of any kind, expressed or implied, is made including but not limited to any representation or warranty concerning accuracy, completeness, correctness, timeliness or appropriateness. We undertake no obligation to update such opinions, analysis or information. You should independently verify all information contained on this website. Some information is based on analysis of past performance or hypothetical performance results, which have inherent limitations. We make no representation that any particular equity or strategy will or is likely to achieve profits or losses similar to those shown. Shareholders, employees, writers, contractors, and affiliates associated with ETFOptimize.com may have ownership positions in the securities that are mentioned. If you are not sure if ETFs, algorithmic investing, or a particular investment is right for you, you are urged to consult with a Registered Investment Advisor (RIA). Neither this website nor anyone associated with producing its content are Registered Investment Advisors, and no attempt is made herein to substitute for personalized, professional investment advice. Neither ETFOptimize.com, Global Alpha Investments, Inc., nor its employees, service providers, associates, or affiliates are responsible for any investment losses you may incur as a result of using the information provided herein. Remember that past investment returns may not be indicative of future returns.

Copyright © 1998-2017 ETFOptimize.com, a publication of Optimized Investments, Inc. All rights reserved.