Freight Delivery Company ArcBest (NASDAQ: ARCB) met Wall Street’s revenue expectations in Q4 CY2024, but sales fell by 8.1% year on year to $1.00 billion. Its non-GAAP profit of $1.33 per share was 26.6% above analysts’ consensus estimates.
Is now the time to buy ArcBest? Find out by accessing our full research report, it’s free.
ArcBest (ARCB) Q4 CY2024 Highlights:
- Revenue: $1.00 billion vs analyst estimates of $999.1 million (8.1% year-on-year decline, in line)
- Adjusted EPS: $1.33 vs analyst estimates of $1.05 (26.6% beat)
- Adjusted EBITDA: $74 million vs analyst estimates of $66.05 million (7.4% margin, 12% beat)
- Operating Margin: 3.8%, down from 5.9% in the same quarter last year
- Free Cash Flow Margin: 0.4%, down from 3.5% in the same quarter last year
- Sales Volumes fell 1.1% year on year, in line with the same quarter last year
- Market Capitalization: $2.21 billion
“Throughout 2024, we made significant progress on controlling costs, improving productivity, and enhancing our service quality,” said Judy R. McReynolds, ArcBest Chairman and CEO.
Company Overview
Historically owning furniture, banking, and other subsidiaries, ArcBest (NASDAQ: ARCB) offers full-truckload, less-than-truckload, and intermodal deliveries of freight.
Ground Transportation
The growth of e-commerce and global trade continues to drive demand for shipping services, especially last-mile delivery, presenting opportunities for ground transportation companies. The industry continues to invest in data, analytics, and autonomous fleets to optimize efficiency and find the most cost-effective routes. Despite the essential services this industry provides, ground transportation companies are still at the whim of economic cycles. Consumer spending, for example, can greatly impact the demand for these companies’ offerings while fuel costs can influence profit margins.
Sales Growth
A company’s long-term performance is an indicator of its overall quality. While any business can experience short-term success, top-performing ones enjoy sustained growth for years. Unfortunately, ArcBest’s 6.9% annualized revenue growth over the last five years was mediocre. This was below our standard for the industrials sector and is a poor baseline for our analysis.
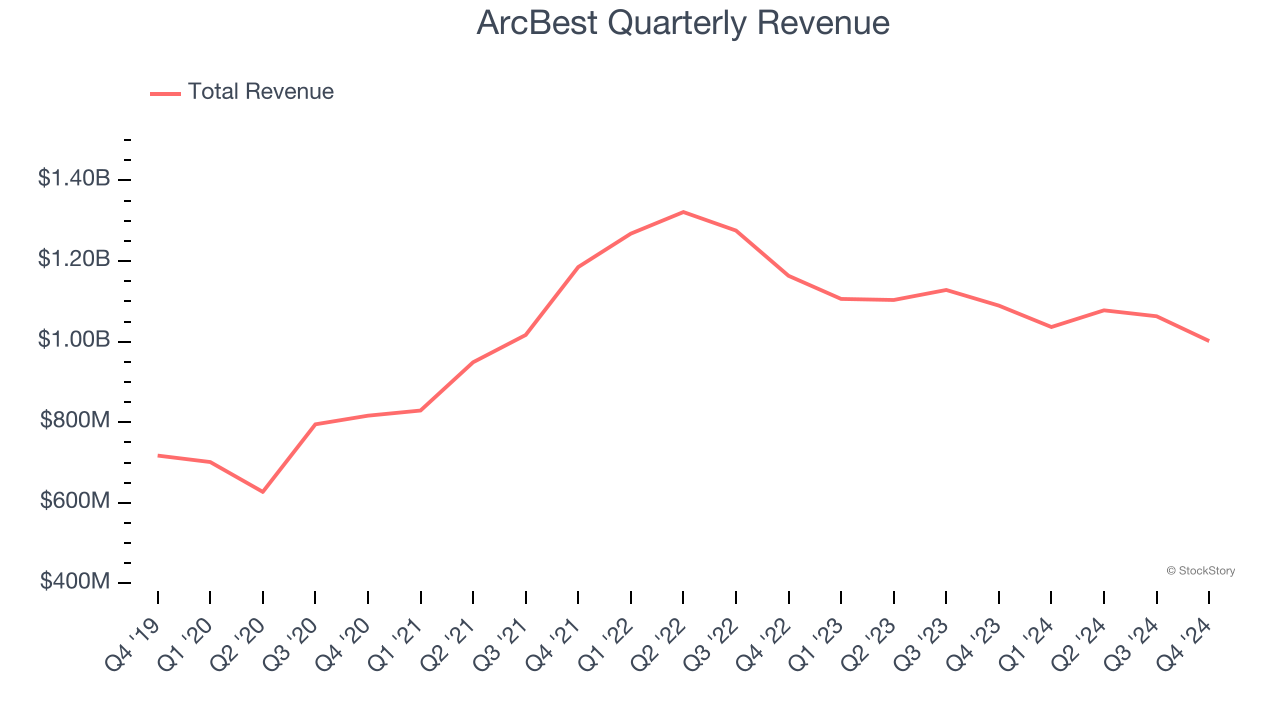
We at StockStory place the most emphasis on long-term growth, but within industrials, a half-decade historical view may miss cycles, industry trends, or a company capitalizing on catalysts such as a new contract win or a successful product line. ArcBest’s history shows it grew in the past but relinquished its gains over the last two years, as its revenue fell by 8.8% annually. ArcBest isn’t alone in its struggles as the Ground Transportation industry experienced a cyclical downturn, with many similar businesses observing lower sales at this time. 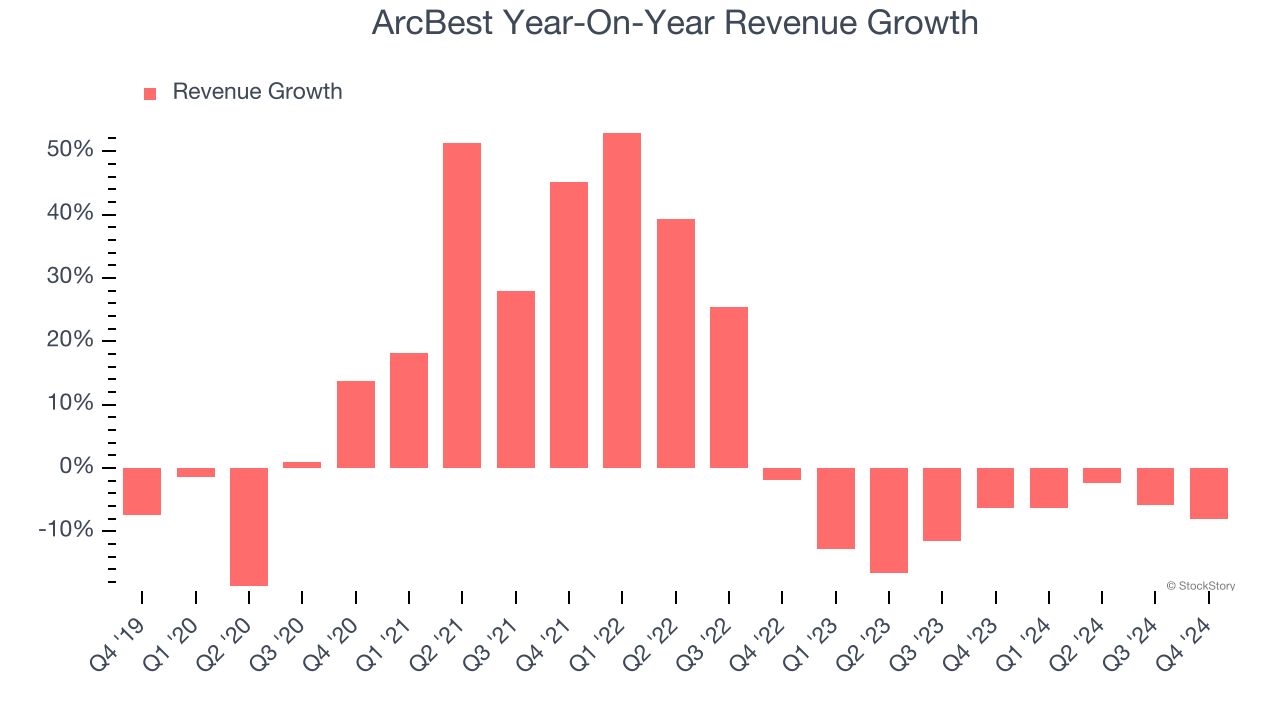
We can dig further into the company’s revenue dynamics by analyzing its units sold, which reached 19,698 in the latest quarter. Over the last two years, ArcBest’s units sold were flat. Because this number is better than its revenue growth, we can see the company’s average selling price decreased. 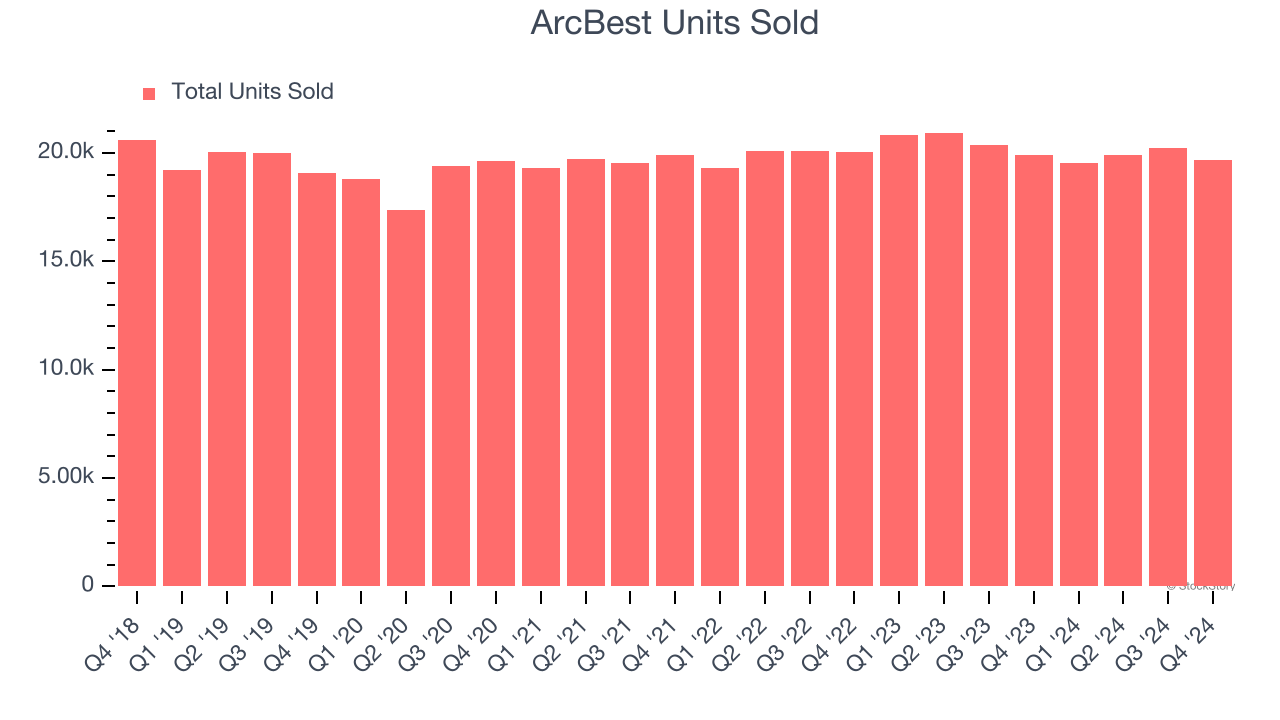
This quarter, ArcBest reported a rather uninspiring 8.1% year-on-year revenue decline to $1.00 billion of revenue, in line with Wall Street’s estimates.
Looking ahead, sell-side analysts expect revenue to grow 3.9% over the next 12 months. Although this projection implies its newer products and services will catalyze better top-line performance, it is still below the sector average.
Here at StockStory, we certainly understand the potential of thematic investing. Diverse winners from Microsoft (MSFT) to Alphabet (GOOG), Coca-Cola (KO) to Monster Beverage (MNST) could all have been identified as promising growth stories with a megatrend driving the growth. So, in that spirit, we’ve identified a relatively under-the-radar profitable growth stock benefiting from the rise of AI, available to you FREE via this link.
Operating Margin
ArcBest was profitable over the last five years but held back by its large cost base. Its average operating margin of 5.8% was weak for an industrials business. This result isn’t too surprising given its low gross margin as a starting point.
On the plus side, ArcBest’s operating margin rose by 2.5 percentage points over the last five years.
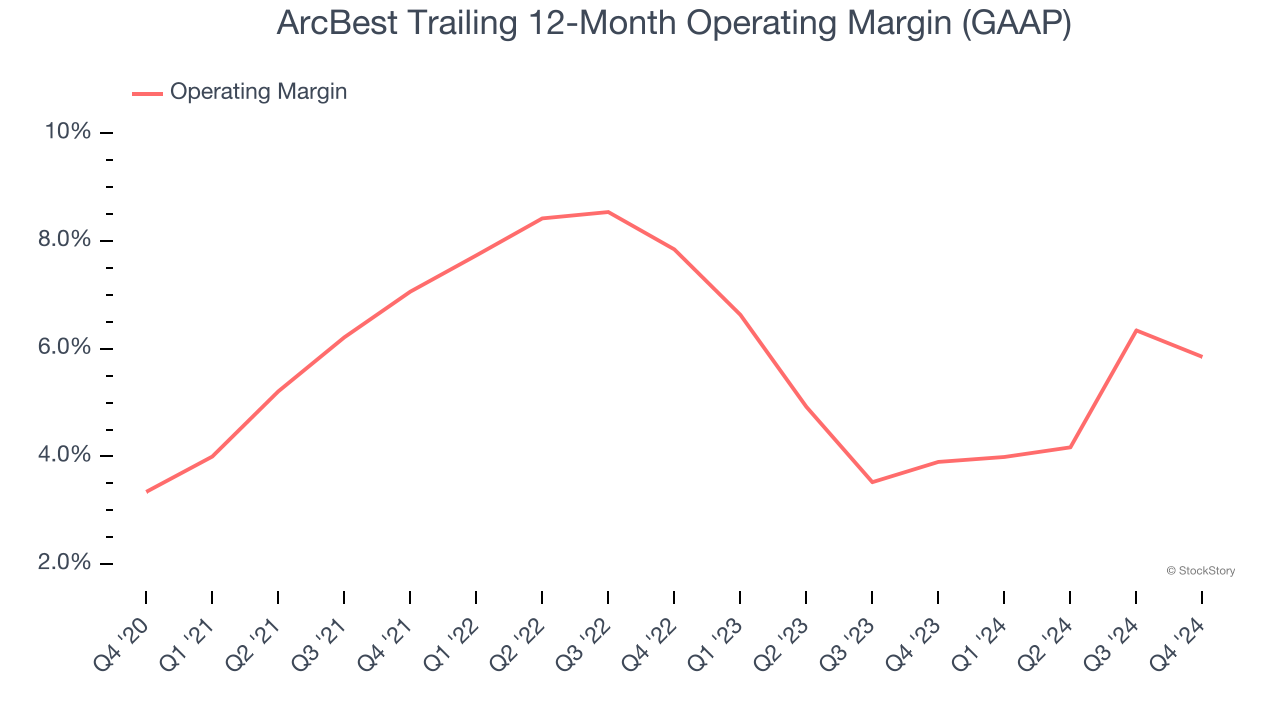
In Q4, ArcBest generated an operating profit margin of 3.8%, down 2.1 percentage points year on year. The contraction shows it was recently less efficient because its expenses increased relative to its revenue.
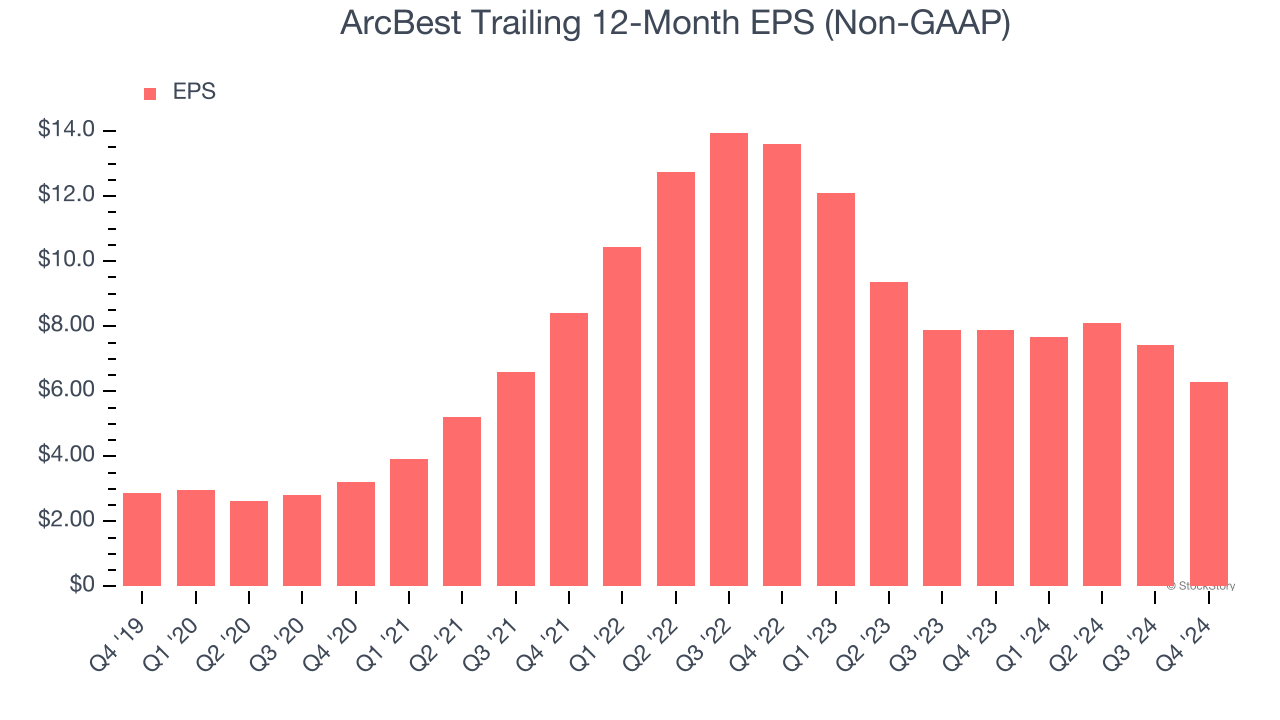
Earnings Per Share
Revenue trends explain a company’s historical growth, but the long-term change in earnings per share (EPS) points to the profitability of that growth – for example, a company could inflate its sales through excessive spending on advertising and promotions.
ArcBest’s EPS grew at a spectacular 17% compounded annual growth rate over the last five years, higher than its 6.9% annualized revenue growth. This tells us the company became more profitable on a per-share basis as it expanded.
Diving into the nuances of ArcBest’s earnings can give us a better understanding of its performance. As we mentioned earlier, ArcBest’s operating margin declined this quarter but expanded by 2.5 percentage points over the last five years. Its share count also shrank by 7.8%, and these factors together are positive signs for shareholders because improving profitability and share buybacks turbocharge EPS growth relative to revenue growth. 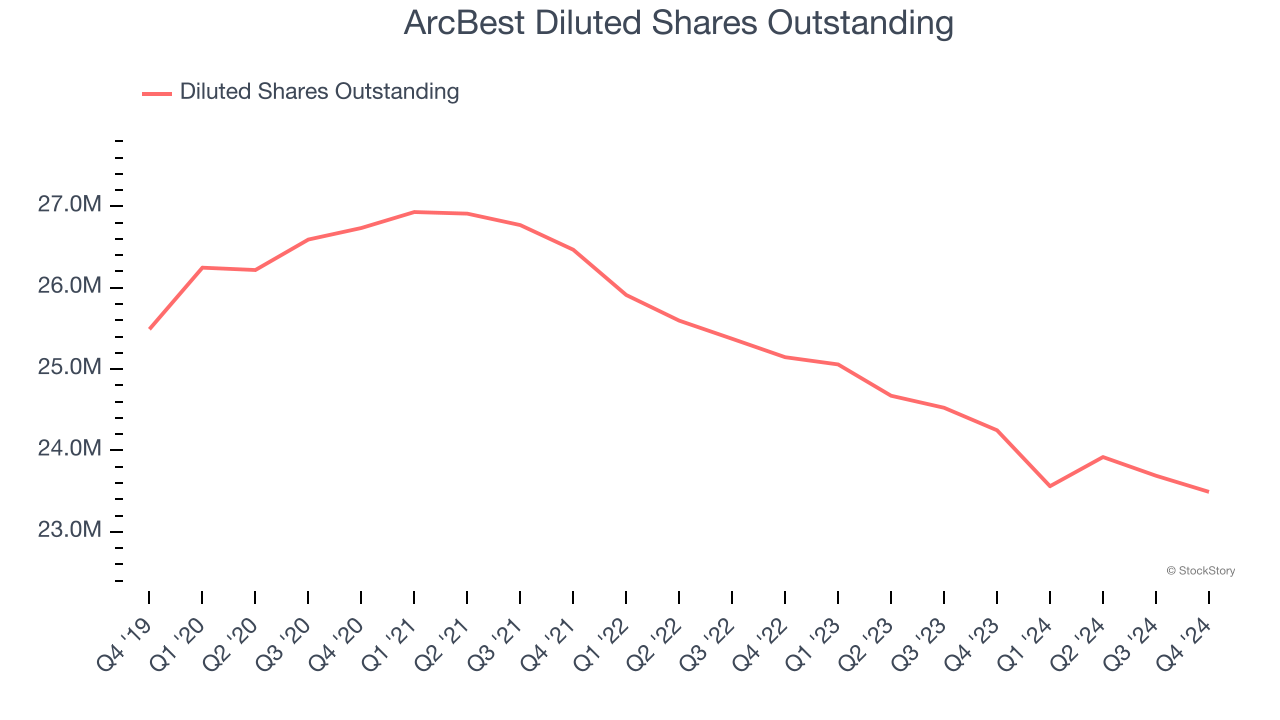
Like with revenue, we analyze EPS over a shorter period to see if we are missing a change in the business.
For ArcBest, its two-year annual EPS declines of 32% mark a reversal from its (seemingly) healthy five-year trend. We hope ArcBest can return to earnings growth in the future.
In Q4, ArcBest reported EPS at $1.33, down from $2.47 in the same quarter last year. Despite falling year on year, this print easily cleared analysts’ estimates. Over the next 12 months, Wall Street expects ArcBest’s full-year EPS of $6.29 to grow 20.4%.
Key Takeaways from ArcBest’s Q4 Results
Despite in line revenue, we were impressed by how ArcBest exceeded analysts’ EBITDA and EPS expectations this quarter, showing better-than-expected profitability. Overall, we think this was still a solid quarter. The stock traded up 5.1% to $99.12 immediately following the results.
ArcBest may have had a good quarter, but does that mean you should invest right now? What happened in the latest quarter matters, but not as much as longer-term business quality and valuation, when deciding whether to invest in this stock. We cover that in our actionable full research report which you can read here, it’s free.