BJ’s 16.7% return over the past six months has outpaced the S&P 500 by 6.3%, and its stock price has climbed to $36.84 per share. This run-up might have investors contemplating their next move.
Is now the time to buy BJ's, or should you be careful about including it in your portfolio? Get the full breakdown from our expert analysts, it’s free.
We’re glad investors have benefited from the price increase, but we're cautious about BJ's. Here are three reasons why there are better opportunities than BJRI and a stock we'd rather own.
Why Do We Think BJ's Will Underperform?
Founded in 1978 in California, BJ’s Restaurants (NASDAQ: BJRI) is a chain of restaurants whose menu features classic American dishes, often with a twist.
1. Long-Term Revenue Growth Disappoints
A company’s long-term sales performance can indicate its overall quality. Any business can put up a good quarter or two, but many enduring ones grow for years. Over the last five years, BJ's grew its sales at a sluggish 3% compounded annual growth rate. This was below our standard for the restaurant sector. 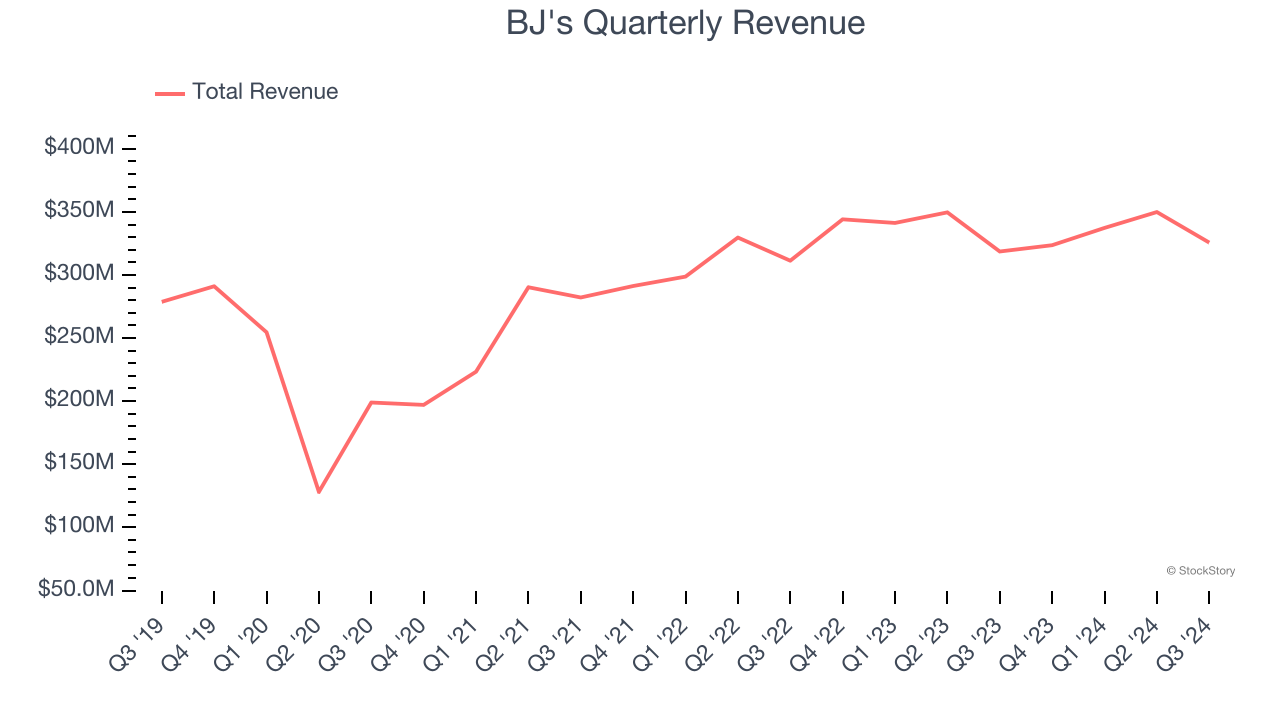
2. Low Gross Margin Reveals Weak Structural Profitability
Gross profit margins tell us how much money a restaurant gets to keep after paying for the direct costs of the meals it sells, like ingredients, and indicate its level of pricing power.
BJ's has bad unit economics for a restaurant company, signaling it operates in a competitive market and has little room for error if demand unexpectedly falls. As you can see below, it averaged a 13.6% gross margin over the last two years. That means BJ's paid its suppliers a lot of money ($86.43 for every $100 in revenue) to run its business. 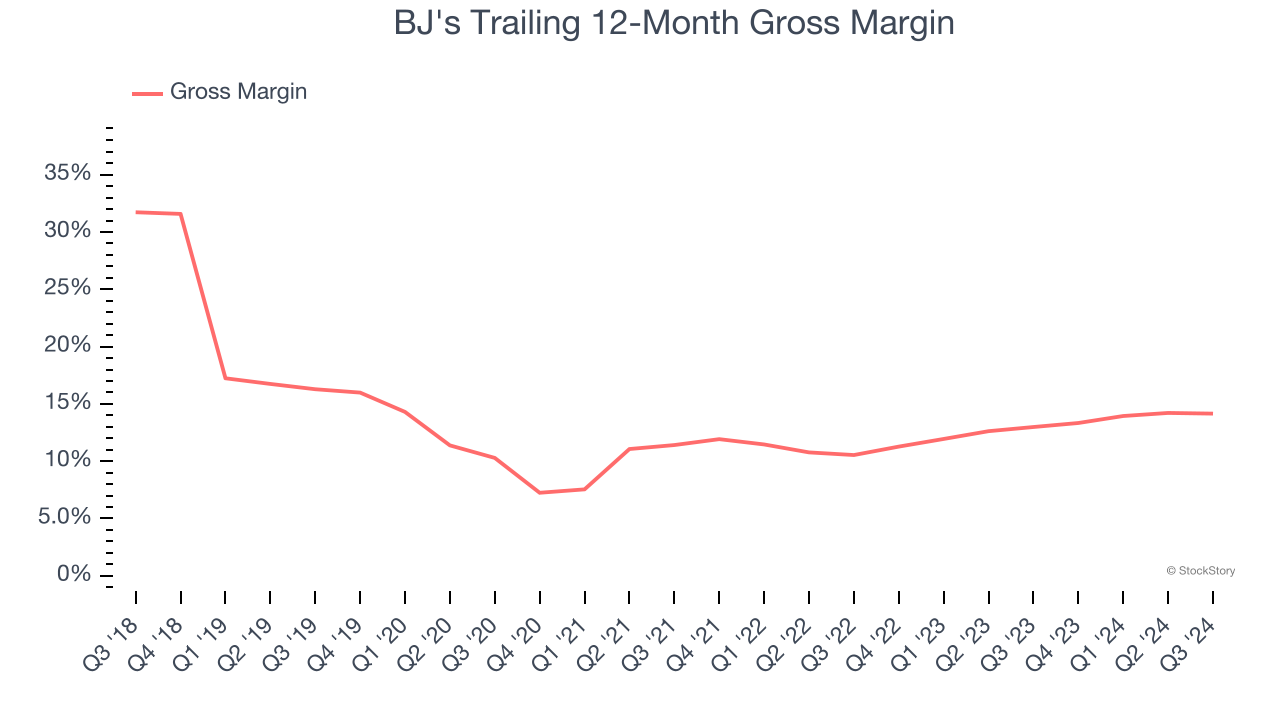
3. Previous Growth Initiatives Haven’t Paid Off Yet
Growth gives us insight into a company’s long-term potential, but how capital-efficient was that growth? Enter ROIC, a metric showing how much operating profit a company generates relative to the money it has raised (debt and equity).
BJ's historically did a mediocre job investing in profitable growth initiatives. Its five-year average ROIC was 0.6%, lower than the typical cost of capital (how much it costs to raise money) for restaurant companies.
Final Judgment
We cheer for all companies serving everyday consumers, but in the case of BJ's, we’ll be cheering from the sidelines. With its shares outperforming the market lately, the stock trades at 25.3× forward price-to-earnings (or $36.84 per share). This valuation multiple is fair, but we don’t have much confidence in the company. There are better investments elsewhere. We’d suggest looking at an all-weather company that owns household favorite Taco Bell.
Stocks We Like More Than BJ's
The Trump trade may have passed, but rates are still dropping and inflation is still cooling. Opportunities are ripe for those ready to act - and we’re here to help you pick them.
Get started by checking out our Top 5 Growth Stocks for this month. This is a curated list of our High Quality stocks that have generated a market-beating return of 175% over the last five years.
Stocks that made our list in 2019 include now familiar names such as Nvidia (+2,183% between December 2019 and December 2024) as well as under-the-radar businesses like Comfort Systems (+751% five-year return). Find your next big winner with StockStory today for free.


