Bright Horizons has been treading water for the past six months, recording a small return of 2.3% while holding steady at $112.46. This is close to the S&P 500’s 7% gain during that period.
Is there a buying opportunity in Bright Horizons, or does it present a risk to your portfolio? Get the full stock story straight from our expert analysts, it’s free.We're sitting this one out for now. Here are three reasons why there are better opportunities than BFAM and a stock we'd rather own.
Why Do We Think Bright Horizons Will Underperform?
Founded in 1986, Bright Horizons (NYSE: BFAM) is a global provider of child care, early education, and workforce support solutions.
1. Slow Organic Growth Suggests Waning Demand In Core Business
We can better understand Education Services companies by analyzing their organic revenue. This metric gives visibility into Bright Horizons’s core business because it excludes one-time events such as mergers, acquisitions, and divestitures along with foreign currency fluctuations - non-fundamental factors that can manipulate the income statement.
Over the last two years, Bright Horizons’s organic revenue averaged 14.3% year-on-year growth. This performance slightly lagged the sector and suggests it may need to improve its products, pricing, or go-to-market strategy, which can add an extra layer of complexity to its operations. 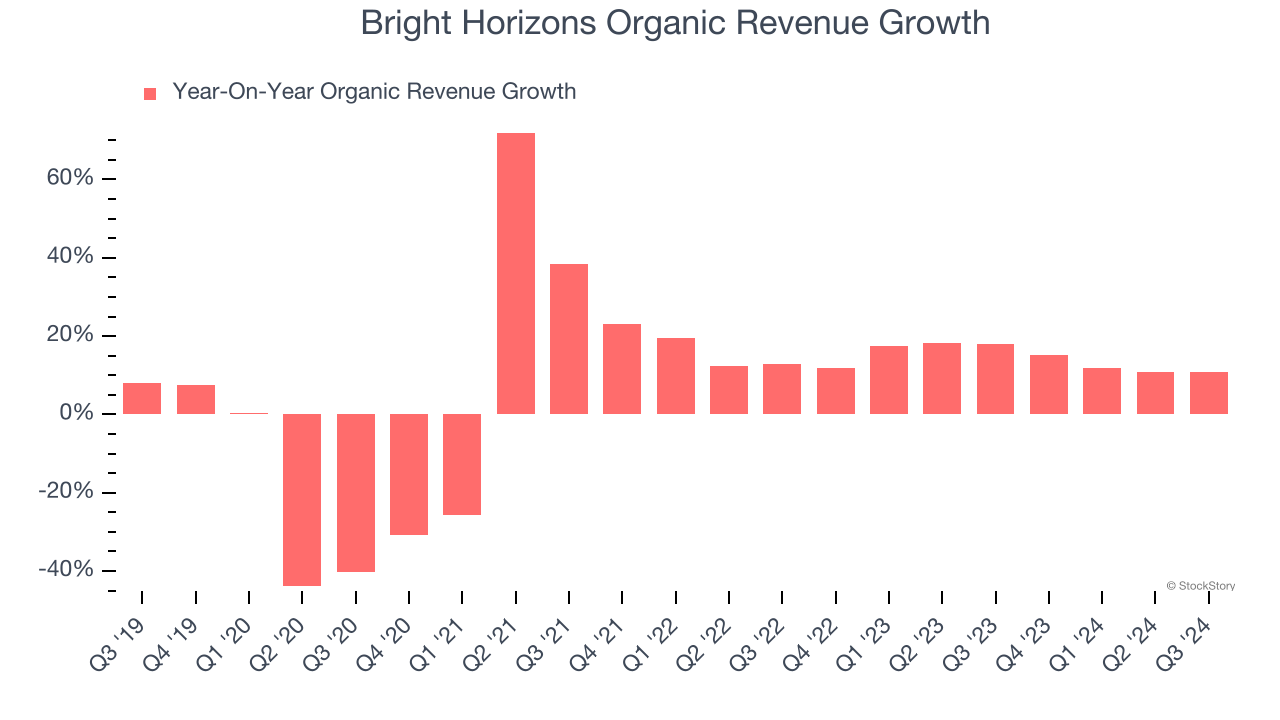
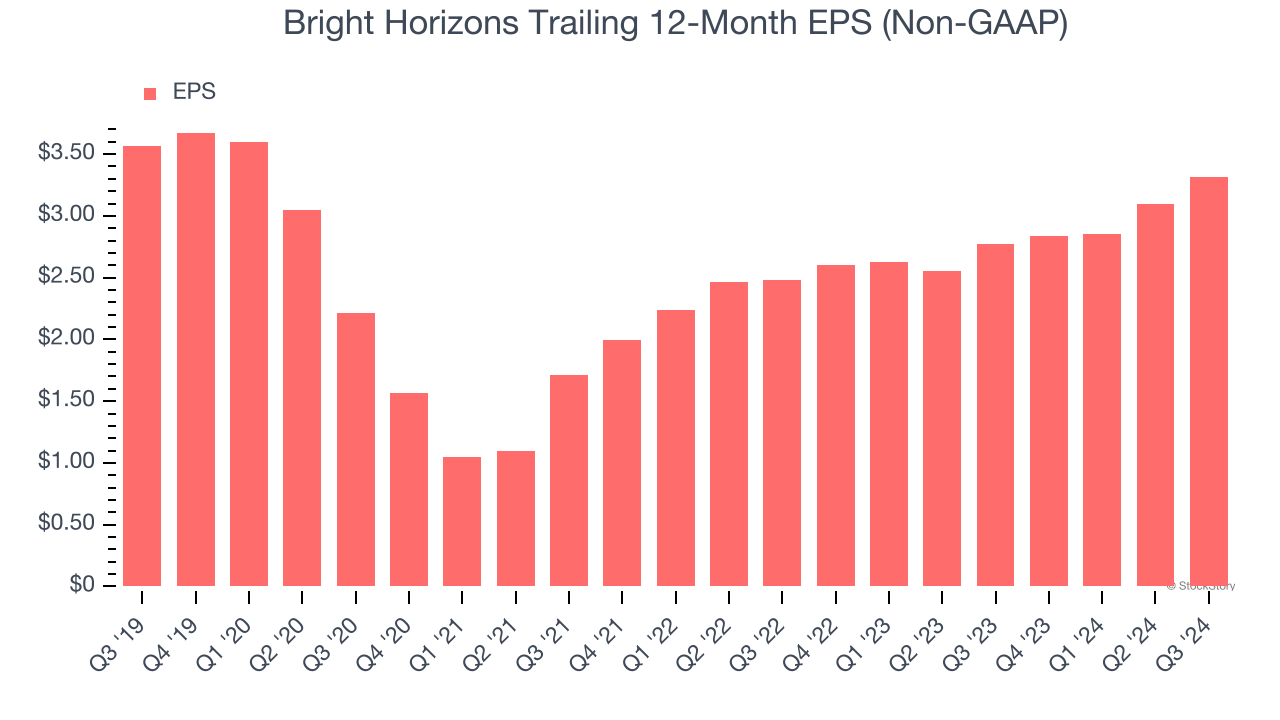
2. EPS Trending Down
Analyzing the long-term change in earnings per share (EPS) shows whether a company's incremental sales were profitable – for example, revenue could be inflated through excessive spending on advertising and promotions.
Sadly for Bright Horizons, its EPS declined by 1.4% annually over the last five years while its revenue grew by 5.4%. This tells us the company became less profitable on a per-share basis as it expanded.
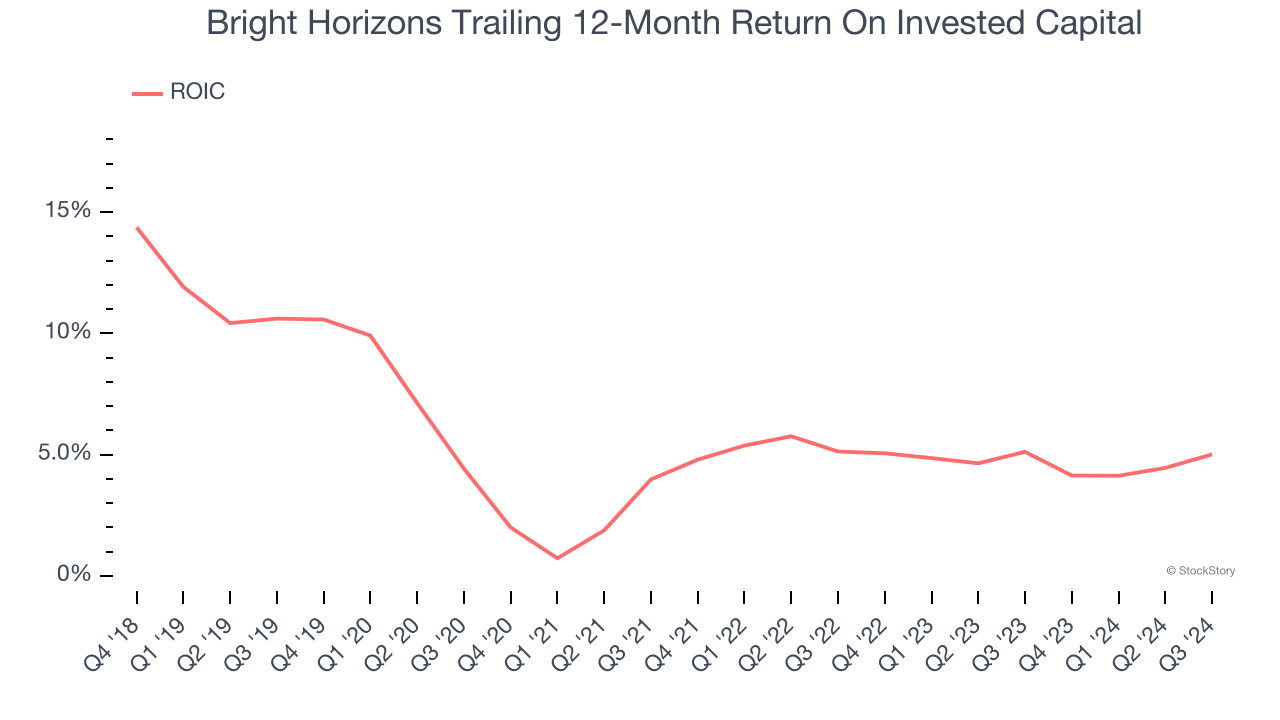
3. Previous Growth Initiatives Haven’t Paid Off Yet
Growth gives us insight into a company’s long-term potential, but how capital-efficient was that growth? Enter ROIC, a metric showing how much operating profit a company generates relative to the money it has raised (debt and equity).
Bright Horizons historically did a mediocre job investing in profitable growth initiatives. Its five-year average ROIC was 4.7%, lower than the typical cost of capital (how much it costs to raise money) for consumer discretionary companies.
Final Judgment
Bright Horizons doesn’t pass our quality test. That said, the stock currently trades at 28.4× forward price-to-earnings (or $112.46 per share). At this valuation, there’s a lot of good news priced in - you can find better investment opportunities elsewhere. We’d recommend looking at Yum! Brands, an all-weather company that owns household favorite Taco Bell.
Stocks We Like More Than Bright Horizons
The Trump trade may have passed, but rates are still dropping and inflation is still cooling. Opportunities are ripe for those ready to act - and we’re here to help you pick them.
Get started by checking out our Top 9 Market-Beating Stocks. This is a curated list of our High Quality stocks that have generated a market-beating return of 175% over the last five years.
Stocks that made our list in 2019 include now familiar names such as Nvidia (+2,691% between September 2019 and September 2024) as well as under-the-radar businesses like United Rentals (+550% five-year return). Find your next big winner with StockStory today for free.