The past six months have been a windfall for Wix’s shareholders. The company’s stock price has jumped 43.9%, hitting $223.74 per share. This was partly due to its solid quarterly results, and the performance may have investors wondering how to approach the situation.
Is now the time to buy Wix, or should you be careful about including it in your portfolio? Check out our in-depth research report to see what our analysts have to say, it’s free.We’re happy investors have made money, but we're cautious about Wix. Here are two reasons why there are better opportunities than WIX and a stock we'd rather own.
Why Is Wix Not Exciting?
Founded in 2006 in Tel Aviv, Wix.com (NASDAQ: WIX) offers a free and easy to operate website building platform.
1. Long-Term Revenue Growth Disappoints
A company’s long-term sales performance signals its overall quality. Even a bad business can shine for one or two quarters, but a top-tier one grows for years. Over the last three years, Wix grew its sales at a 11.8% compounded annual growth rate. Although this growth is solid on an absolute basis, it fell short of our benchmark for the software sector. 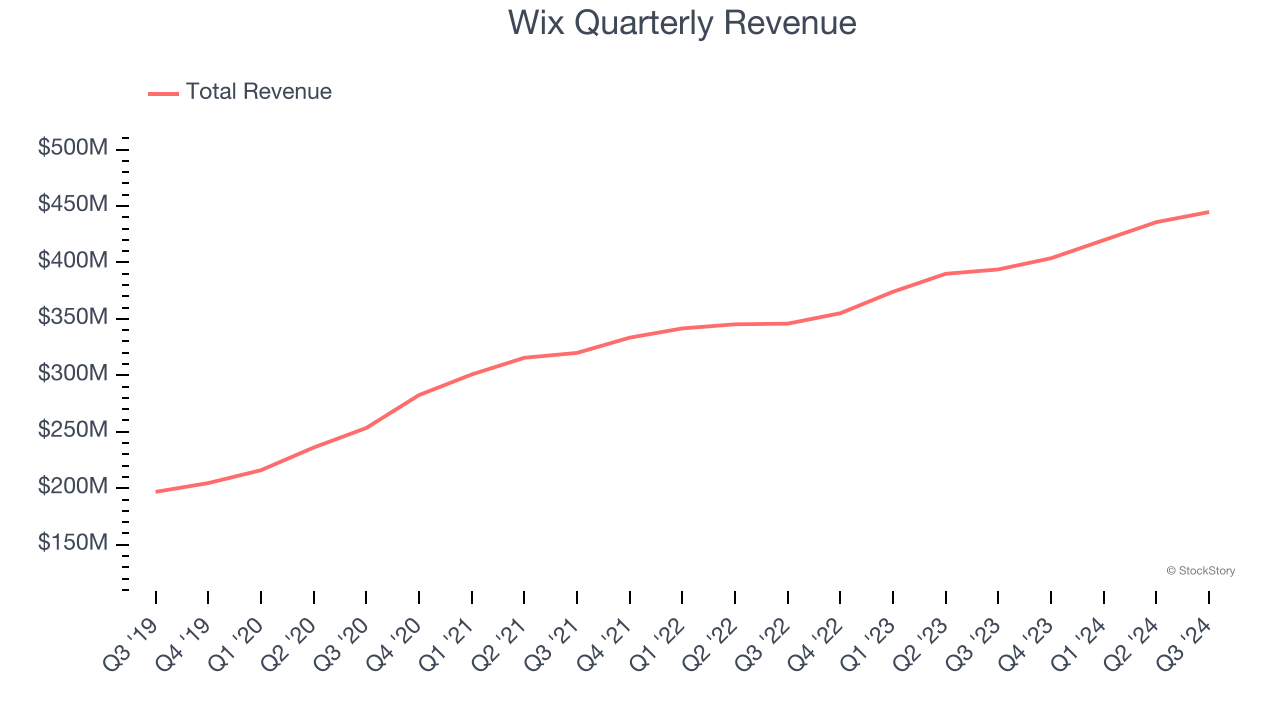
2. Low Gross Margin Reveals Weak Structural Profitability
For software companies like Wix, gross profit tells us how much money remains after paying for the base cost of products and services (typically servers, licenses, and certain personnel). These costs are usually low as a percentage of revenue, explaining why software is more lucrative than other sectors.
Wix’s gross margin is worse than the software industry average, giving it less room than its competitors to hire new talent that can expand its products and services. As you can see below, it averaged a 67.9% gross margin over the last year. That means Wix paid its providers a lot of money ($32.12 for every $100 in revenue) to run its business. 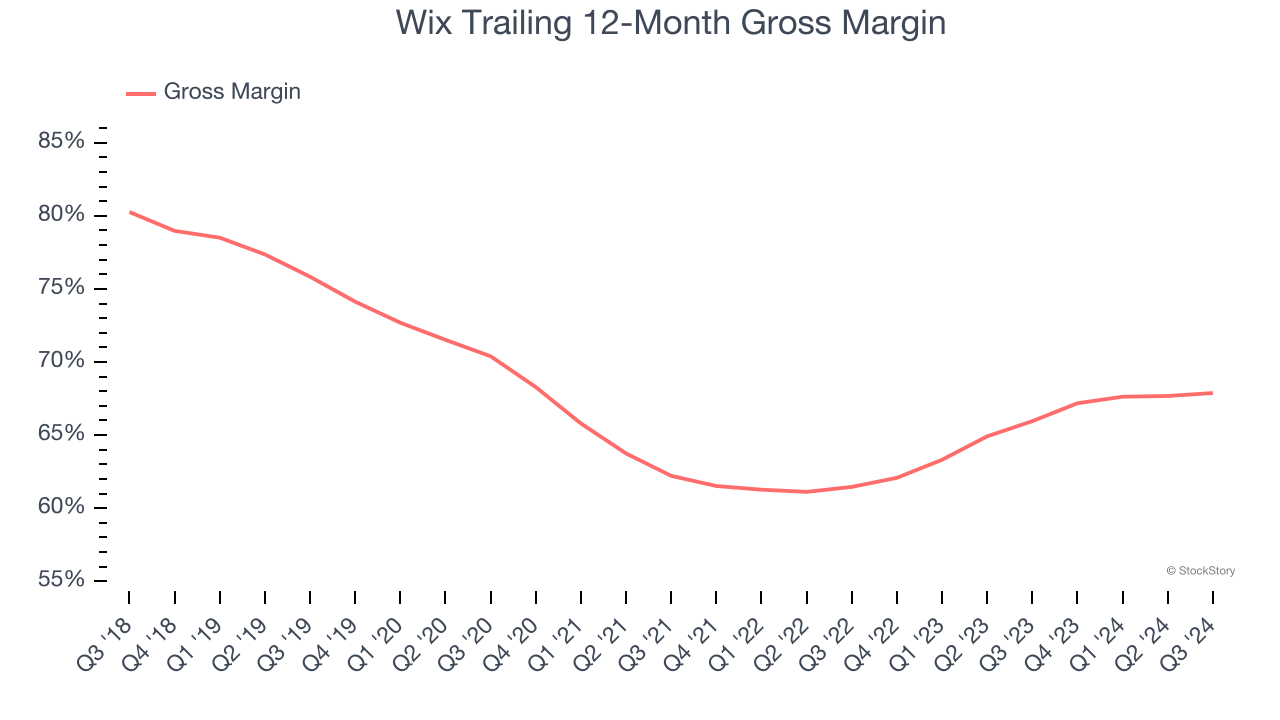
Final Judgment
Wix isn’t a terrible business, but it isn’t one of our picks. Following the recent rally, the stock trades at 6.7× forward price-to-sales (or $223.74 per share). Investors with a higher risk tolerance might like the company, but we think the potential downside is too great. We're pretty confident there are more exciting stocks to buy at the moment. We’d recommend looking at KLA Corporation, a picks and shovels play for semiconductor manufacturing.
Stocks We Like More Than Wix
The elections are now behind us. With rates dropping and inflation cooling, many analysts expect a breakout market to cap off the year - and we’re zeroing in on the stocks that could benefit immensely.
Take advantage of the rebound by checking out our Top 5 Growth Stocks for this month. This is a curated list of our High Quality stocks that have generated a market-beating return of 175% over the last five years.
Stocks that made our list in 2019 include now familiar names such as Nvidia (+2,691% between September 2019 and September 2024) as well as under-the-radar businesses like United Rentals (+550% five-year return). Find your next big winner with StockStory today for free.