
Since January 2020, the S&P 500 has delivered a total return of 84.6%. But one standout stock has more than doubled the market - over the past five years, Kadant has surged 226% to $351.01 per share. Its momentum hasn’t stopped as it’s also gained 17.1% in the last six months thanks to its solid quarterly results, beating the S&P by 9.8%.
Is now the time to buy Kadant, or should you be careful about including it in your portfolio? Get the full breakdown from our expert analysts, it’s free.We’re glad investors have benefited from the price increase, but we're cautious about Kadant. Here are two reasons why KAI doesn't excite us and a stock we'd rather own.
Why Is Kadant Not Exciting?
Headquartered in Massachusetts, Kadant (NYSE: KAI) is a global supplier of high-value, critical components and engineered systems used in process industries worldwide.
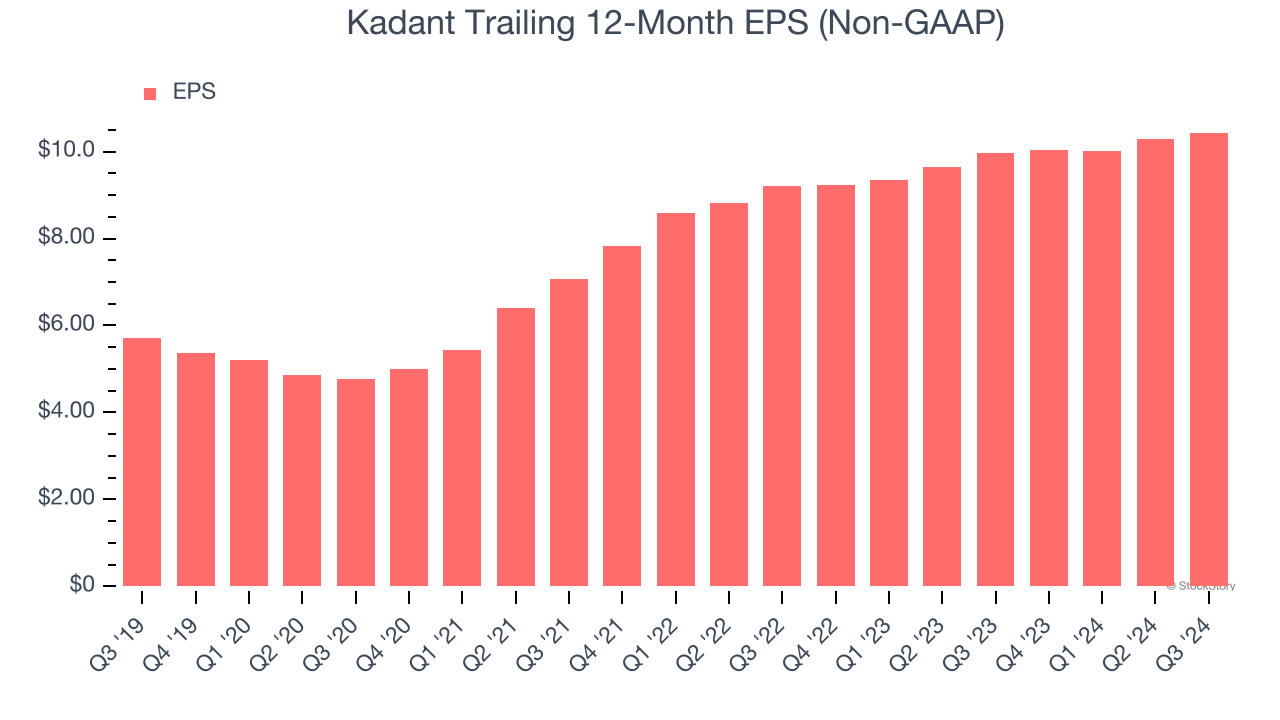
1. Recent EPS Growth Below Our Standards
While long-term earnings trends give us the big picture, we also track EPS over a shorter period because it can provide insight into an emerging theme or development for the business.
Kadant’s EPS grew at an unimpressive 6.4% compounded annual growth rate over the last two years, lower than its 7.7% annualized revenue growth. This tells us the company became less profitable on a per-share basis as it expanded.
2. Projected Revenue Growth Is Slim
Forecasted revenues by Wall Street analysts signal a company’s potential. Predictions may not always be accurate, but accelerating growth typically boosts valuation multiples and stock prices while slowing growth does the opposite.
Over the next 12 months, sell-side analysts expect Kadant’s revenue to rise by 4.7%, a deceleration versus its 7.7% annualized growth for the past two years. This projection is underwhelming and implies its products and services will see some demand headwinds.
Final Judgment
Kadant’s business quality ultimately falls short of our standards. With its shares beating the market recently, the stock trades at 34.5× forward price-to-earnings (or $351.01 per share). At this valuation, there’s a lot of good news priced in - you can find better investment opportunities elsewhere. We’d recommend looking at Yum! Brands, an all-weather company that owns household favorite Taco Bell.
Stocks We Like More Than Kadant
The elections are now behind us. With rates dropping and inflation cooling, many analysts expect a breakout market to cap off the year - and we’re zeroing in on the stocks that could benefit immensely.
Take advantage of the rebound by checking out our Top 6 Stocks for this week. This is a curated list of our High Quality stocks that have generated a market-beating return of 175% over the last five years.
Stocks that made our list in 2019 include now familiar names such as Nvidia (+2,691% between September 2019 and September 2024) as well as under-the-radar businesses like United Rentals (+550% five-year return). Find your next big winner with StockStory today for free.