Even though IBM (currently trading at $282.09 per share) has gained 12.7% over the last six months, it has lagged the S&P 500’s 18.8% return during that period. This may have investors wondering how to approach the situation.
Is now the time to buy IBM, or should you be careful about including it in your portfolio? See what our analysts have to say in our full research report, it’s free.
Why Is IBM Not Exciting?
We're swiping left on IBM for now. Here are three reasons we avoid IBM and a stock we'd rather own.
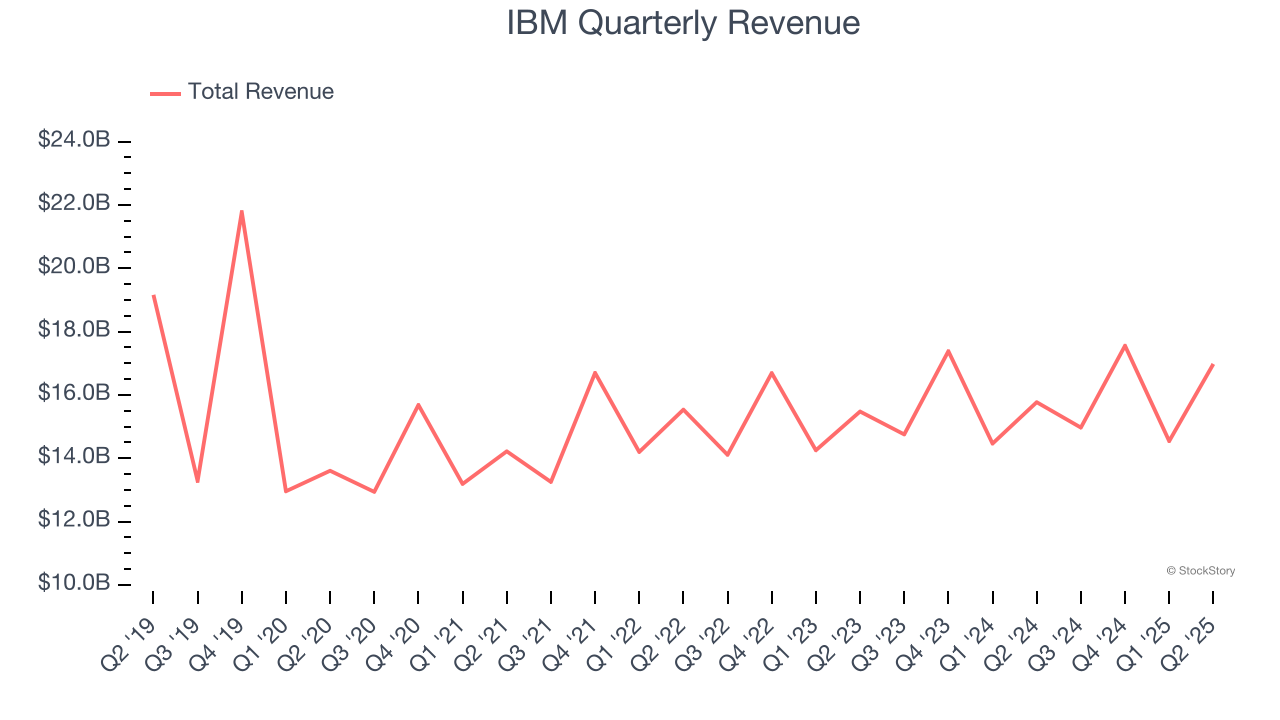
1. Long-Term Revenue Growth Flatter Than a Pancake
Reviewing a company’s long-term sales performance reveals insights into its quality. Any business can put up a good quarter or two, but the best consistently grow over the long haul. Unfortunately, IBM struggled to consistently increase demand as its $64.04 billion of sales for the trailing 12 months was close to its revenue five years ago. This wasn’t a great result and signals it’s a lower quality business.
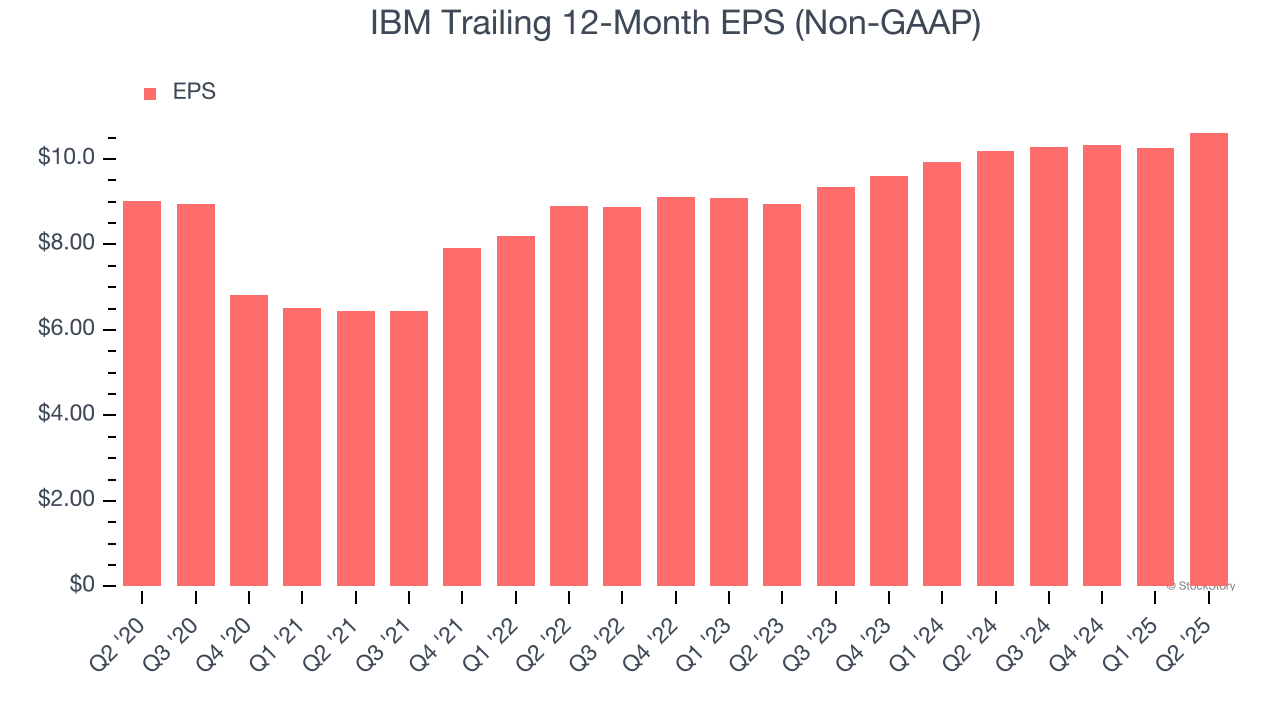
2. EPS Barely Growing
Analyzing the long-term change in earnings per share (EPS) shows whether a company's incremental sales were profitable – for example, revenue could be inflated through excessive spending on advertising and promotions.
IBM’s EPS grew at a weak 3.3% compounded annual growth rate over the last five years. On the bright side, this performance was better than its flat revenue and tells us management responded to softer demand by adapting its cost structure.
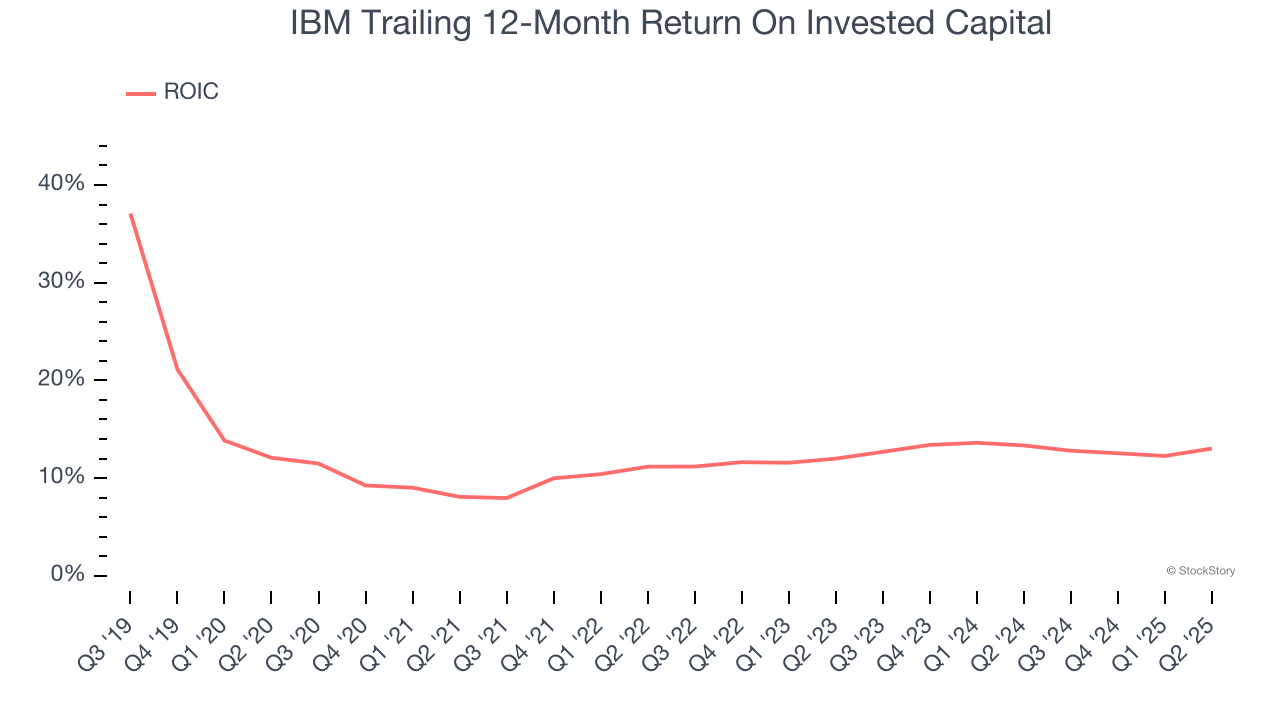
3. Previous Growth Initiatives Haven’t Impressed
Growth gives us insight into a company’s long-term potential, but how capital-efficient was that growth? Enter ROIC, a metric showing how much operating profit a company generates relative to the money it has raised (debt and equity).
IBM historically did a mediocre job investing in profitable growth initiatives. Its five-year average ROIC was 11.5%, somewhat low compared to the best business services companies that consistently pump out 25%+.
Final Judgment
IBM’s business quality ultimately falls short of our standards. With its shares underperforming the market lately, the stock trades at 24.9× forward P/E (or $282.09 per share). Beauty is in the eye of the beholder, but our analysis shows the upside isn’t great compared to the potential downside. We're pretty confident there are more exciting stocks to buy at the moment. Let us point you toward a top digital advertising platform riding the creator economy.
Stocks We Like More Than IBM
Donald Trump’s April 2025 "Liberation Day" tariffs sent markets into a tailspin, but stocks have since rebounded strongly, proving that knee-jerk reactions often create the best buying opportunities.
The smart money is already positioning for the next leg up. Don’t miss out on the recovery - check out our Top 5 Strong Momentum Stocks for this week. This is a curated list of our High Quality stocks that have generated a market-beating return of 183% over the last five years (as of March 31st 2025).
Stocks that made our list in 2020 include now familiar names such as Nvidia (+1,545% between March 2020 and March 2025) as well as under-the-radar businesses like the once-small-cap company Comfort Systems (+782% five-year return). Find your next big winner with StockStory today.
StockStory is growing and hiring equity analyst and marketing roles. Are you a 0 to 1 builder passionate about the markets and AI? See the open roles here.