
Tennant currently trades at $81.06 per share and has shown little upside over the past six months, posting a middling return of 0.9%. The stock also fell short of the S&P 500’s 18.8% gain during that period.
Is now the time to buy Tennant, or should you be careful about including it in your portfolio? Get the full stock story straight from our expert analysts, it’s free.
Why Do We Think Tennant Will Underperform?
We're sitting this one out for now. Here are three reasons you should be careful with TNC and a stock we'd rather own.
1. Long-Term Revenue Growth Disappoints
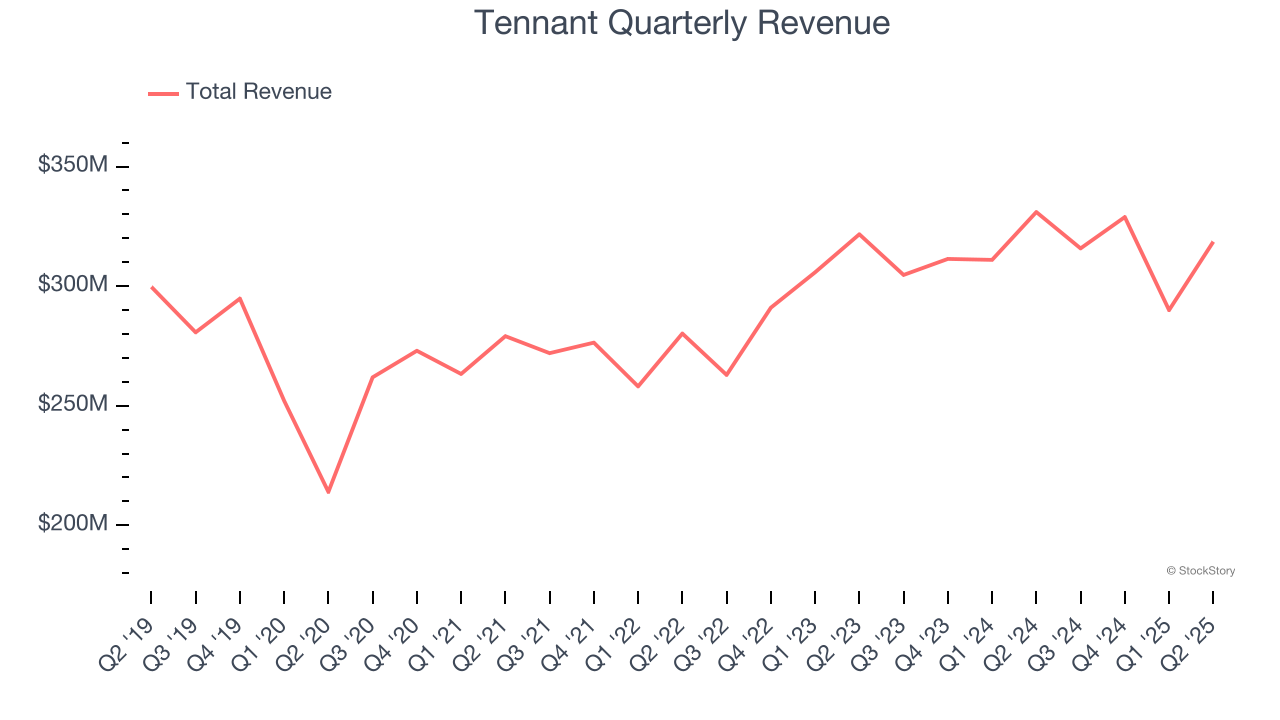
Reviewing a company’s long-term sales performance reveals insights into its quality. Even a bad business can shine for one or two quarters, but a top-tier one grows for years. Regrettably, Tennant’s sales grew at a sluggish 3.8% compounded annual growth rate over the last five years. This fell short of our benchmark for the industrials sector.
2. EPS Took a Dip Over the Last Two Years
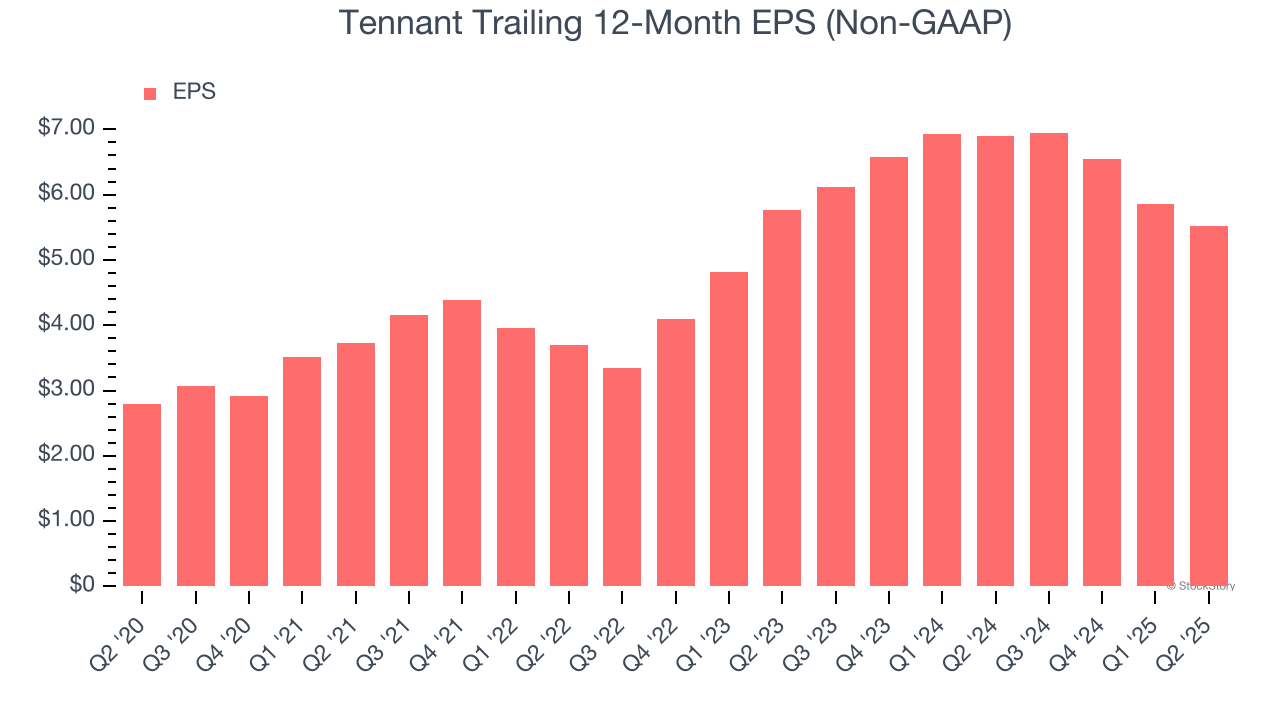
Although long-term earnings trends give us the big picture, we like to analyze EPS over a shorter period to see if we are missing a change in the business.
Sadly for Tennant, its EPS declined by 2.1% annually over the last two years while its revenue grew by 3%. This tells us the company became less profitable on a per-share basis as it expanded.
3. Free Cash Flow Margin Dropping
If you’ve followed StockStory for a while, you know we emphasize free cash flow. Why, you ask? We believe that in the end, cash is king, and you can’t use accounting profits to pay the bills.
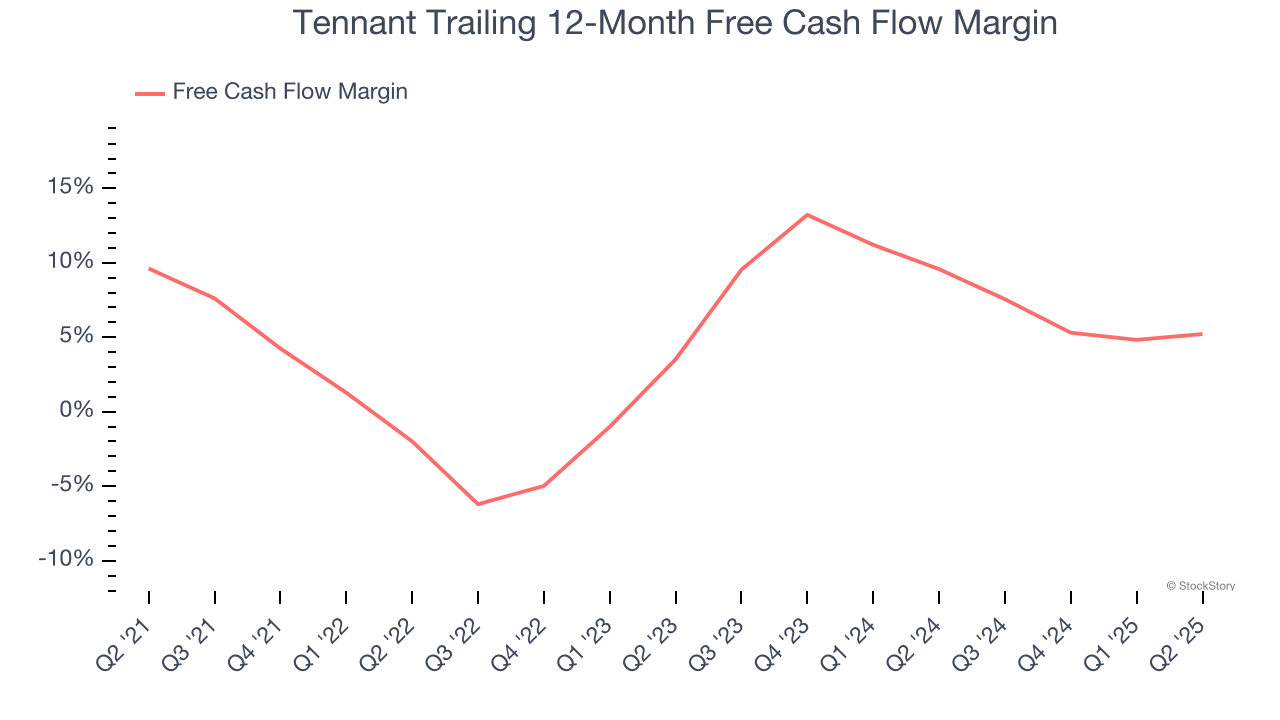
As you can see below, Tennant’s margin dropped by 4.4 percentage points over the last five years. This along with its unexciting margin put the company in a tough spot, and shareholders are likely hoping it can reverse course. If the trend continues, it could signal it’s becoming a more capital-intensive business. Tennant’s free cash flow margin for the trailing 12 months was 5.2%.
Final Judgment
Tennant doesn’t pass our quality test. With its shares trailing the market in recent months, the stock trades at 13.2× forward P/E (or $81.06 per share). This valuation multiple is fair, but we don’t have much confidence in the company. There are better stocks to buy right now. Let us point you toward one of our top digital advertising picks.
Stocks We Like More Than Tennant
Trump’s April 2025 tariff bombshell triggered a massive market selloff, but stocks have since staged an impressive recovery, leaving those who panic sold on the sidelines.
Take advantage of the rebound by checking out our Top 5 Strong Momentum Stocks for this week. This is a curated list of our High Quality stocks that have generated a market-beating return of 183% over the last five years (as of March 31st 2025).
Stocks that made our list in 2020 include now familiar names such as Nvidia (+1,545% between March 2020 and March 2025) as well as under-the-radar businesses like the once-small-cap company Comfort Systems (+782% five-year return). Find your next big winner with StockStory today.
StockStory is growing and hiring equity analyst and marketing roles. Are you a 0 to 1 builder passionate about the markets and AI? See the open roles here.