MACOM trades at $124.49 per share and has stayed right on track with the overall market, gaining 22.9% over the last six months. At the same time, the S&P 500 has returned 18.8%.
Is now a good time to buy MTSI? Find out in our full research report, it’s free.
Why Does MACOM Spark Debate?
Founded in the 1950s as Microwave Associates, a communications supplier to the US Army Signal Corp, today MACOM Technology Solutions (NASDAQ: MTSI) is a provider of analog chips used in optical, wireless, and satellite networks.
Two Positive Attributes:
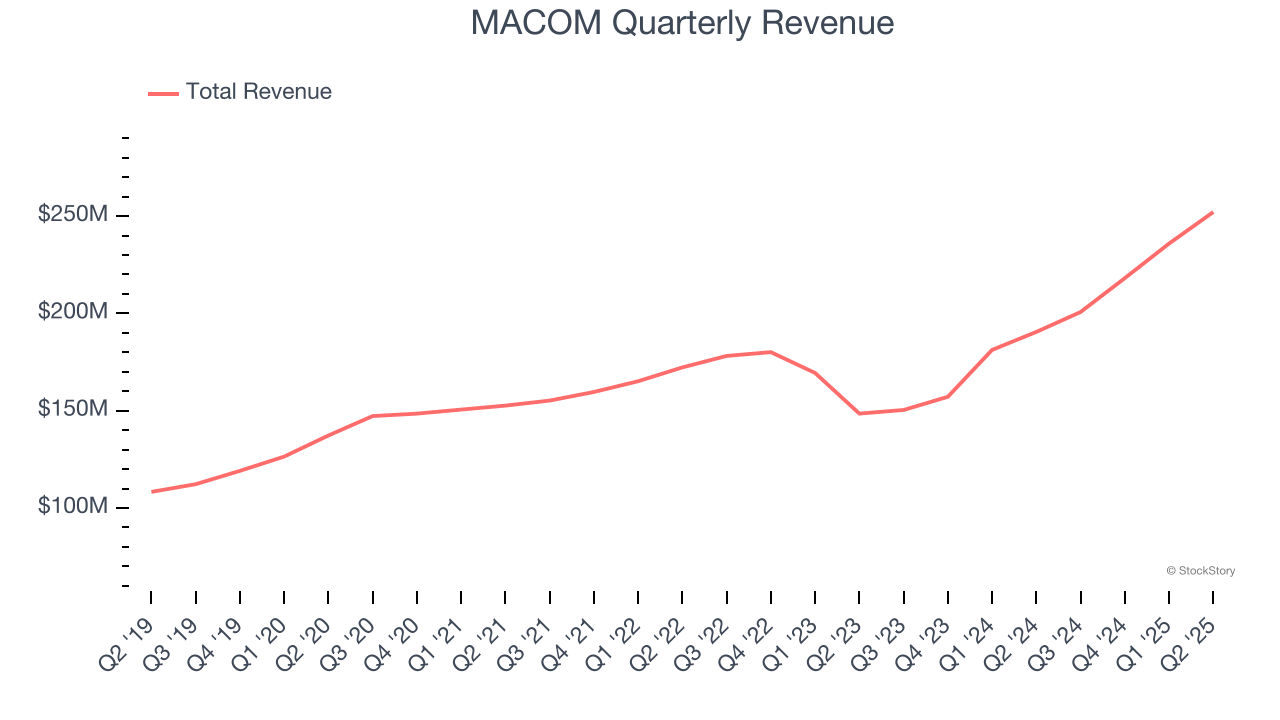
1. Skyrocketing Revenue Shows Strong Momentum
Examining a company’s long-term performance can provide clues about its quality. Any business can experience short-term success, but top-performing ones enjoy sustained growth for years. Luckily, MACOM’s sales grew at an impressive 12.9% compounded annual growth rate over the last five years. Its growth surpassed the average semiconductor company and shows its offerings resonate with customers. Semiconductors are a cyclical industry, and long-term investors should be prepared for periods of high growth followed by periods of revenue contractions.
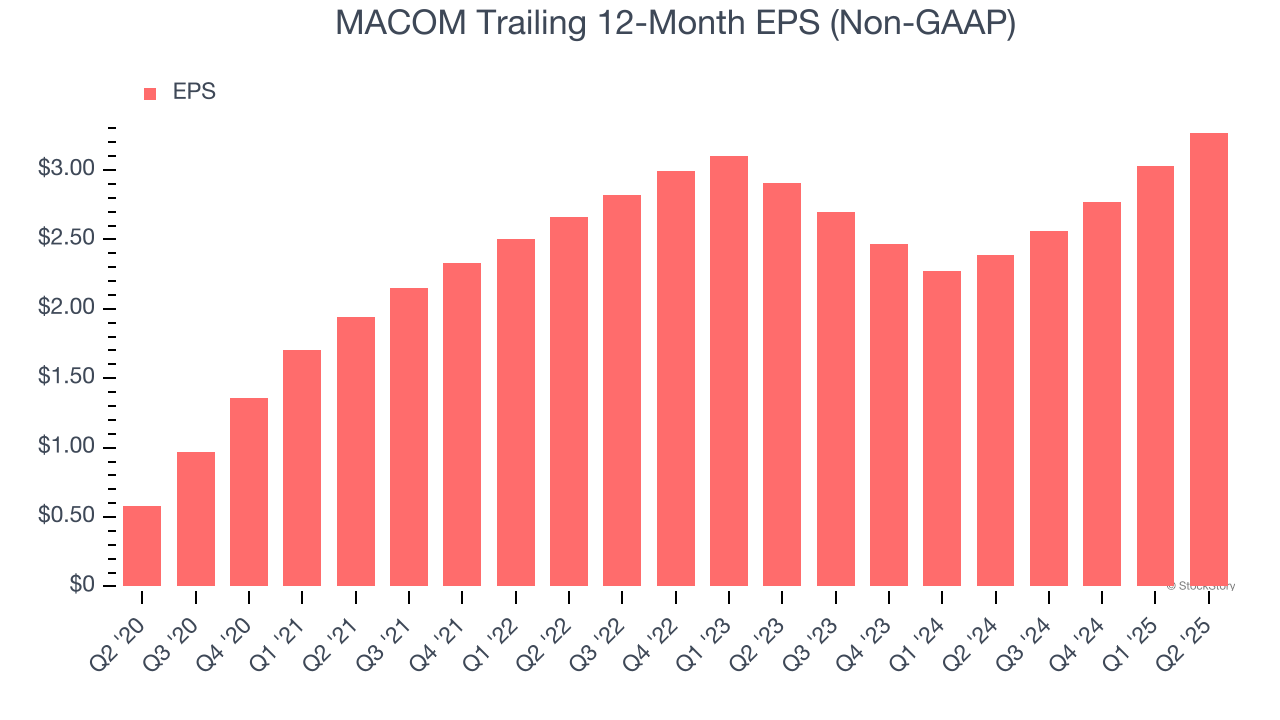
2. Outstanding Long-Term EPS Growth
Analyzing the long-term change in earnings per share (EPS) shows whether a company's incremental sales were profitable – for example, revenue could be inflated through excessive spending on advertising and promotions.
MACOM’s EPS grew at an astounding 41.3% compounded annual growth rate over the last five years, higher than its 12.9% annualized revenue growth. This tells us the company became more profitable on a per-share basis as it expanded.
One Reason to be Careful:
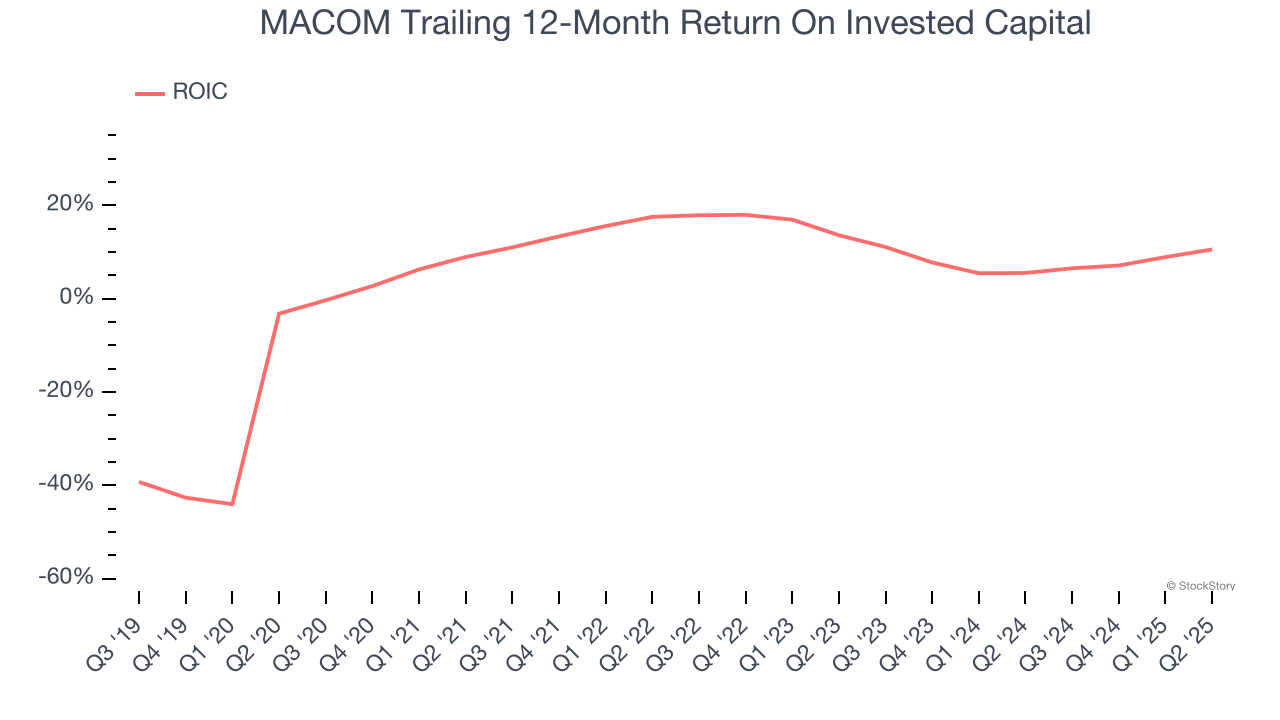
Previous Growth Initiatives Haven’t Impressed
Growth gives us insight into a company’s long-term potential, but how capital-efficient was that growth? Enter ROIC, a metric showing how much operating profit a company generates relative to the money it has raised (debt and equity).
Although MACOM has shown solid business quality lately, it historically did a mediocre job investing in profitable growth initiatives. Its five-year average ROIC was 11.2%, somewhat low compared to the best semiconductor companies that consistently pump out 35%+.
Final Judgment
MACOM has huge potential even though it has some open questions, but at $124.49 per share (or 31.8× forward P/E), is now the time to initiate a position? See for yourself in our full research report, it’s free.
High-Quality Stocks for All Market Conditions
Donald Trump’s April 2025 "Liberation Day" tariffs sent markets into a tailspin, but stocks have since rebounded strongly, proving that knee-jerk reactions often create the best buying opportunities.
The smart money is already positioning for the next leg up. Don’t miss out on the recovery - check out our Top 5 Strong Momentum Stocks for this week. This is a curated list of our High Quality stocks that have generated a market-beating return of 183% over the last five years (as of March 31st 2025).
Stocks that made our list in 2020 include now familiar names such as Nvidia (+1,545% between March 2020 and March 2025) as well as under-the-radar businesses like the once-micro-cap company Tecnoglass (+1,754% five-year return). Find your next big winner with StockStory today.
StockStory is growing and hiring equity analyst and marketing roles. Are you a 0 to 1 builder passionate about the markets and AI? See the open roles here.