
Over the past six months, Jack Henry’s stock price fell to $150. Shareholders have lost 13.7% of their capital, which is disappointing considering the S&P 500 has climbed by 21.1%. This might have investors contemplating their next move.
Following the pullback, is now a good time to buy JKHY? Find out in our full research report, it’s free for active Edge members.
Why Does Jack Henry Spark Debate?
Founded in 1976 by two entrepreneurs who saw the need for specialized banking software in the early days of financial computing, Jack Henry & Associates (NASDAQ: JKHY) provides technology solutions that help banks and credit unions innovate, differentiate, and compete while serving the evolving needs of their accountholders.
Two Things to Like:
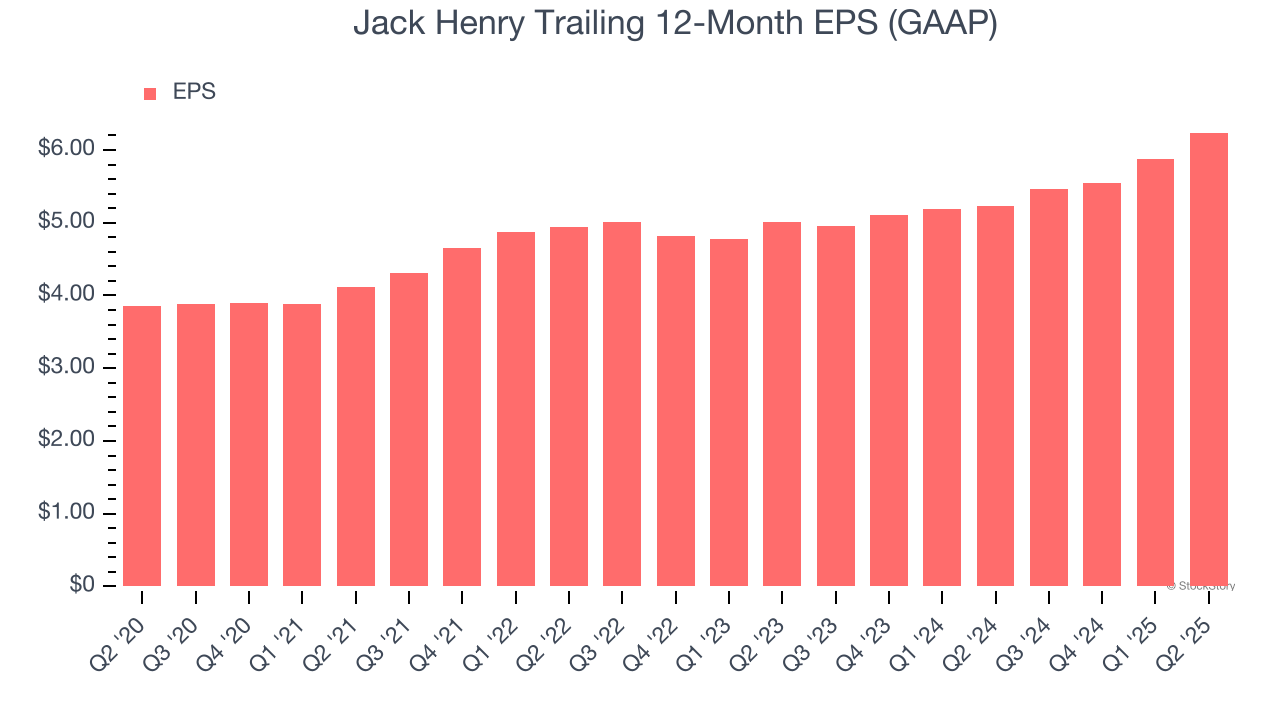
1. EPS Moving Up Steadily
Analyzing the long-term change in earnings per share (EPS) shows whether a company's incremental sales were profitable – for example, revenue could be inflated through excessive spending on advertising and promotions.
Jack Henry’s EPS grew at a decent 10.1% compounded annual growth rate over the last five years, higher than its 7% annualized revenue growth. This tells us the company became more profitable on a per-share basis as it expanded.
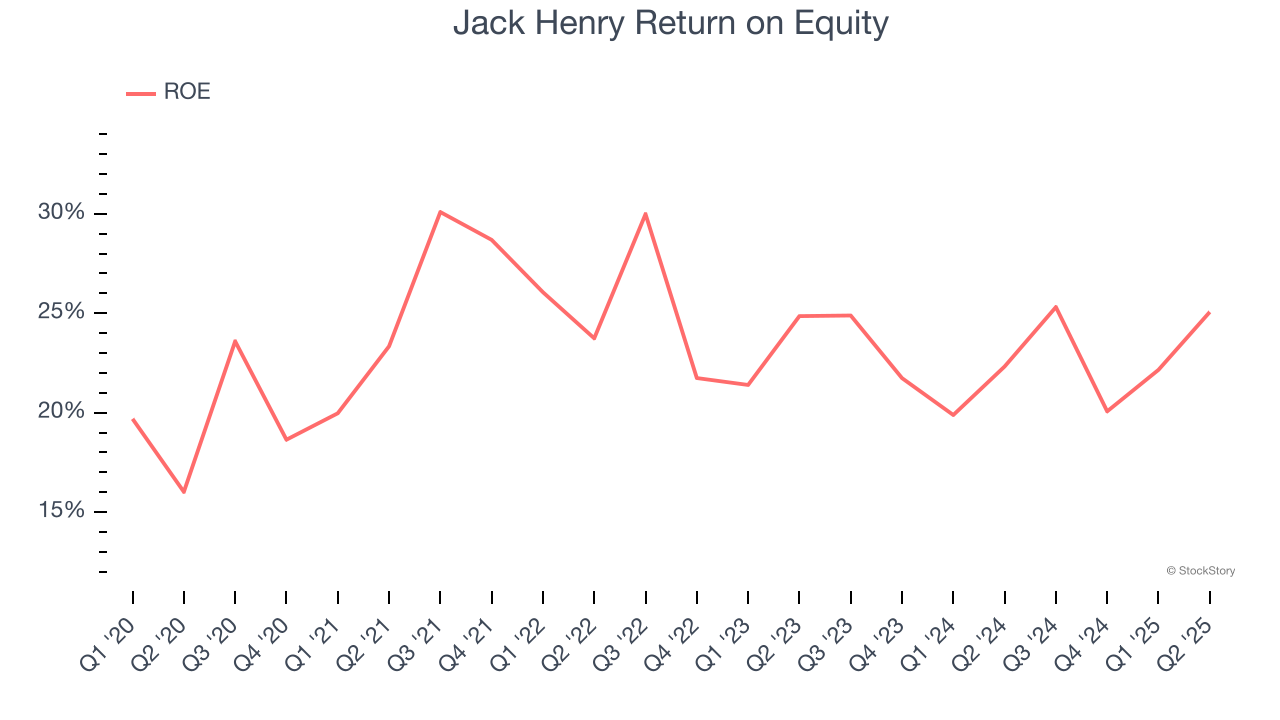
2. Stellar ROE Showcases Lucrative Growth Opportunities
Return on equity (ROE) reveals the profit generated per dollar of shareholder equity, which represents a key source of bank funding. Banks maintaining elevated ROE levels tend to accelerate wealth creation for shareholders via earnings retention, buybacks, and distributions.
Over the last five years, Jack Henry has averaged an ROE of 23.7%, exceptional for a company operating in a sector where the average shakes out around 10% and those putting up 25%+ are greatly admired. This shows Jack Henry has a strong competitive moat.
One Reason to be Careful:
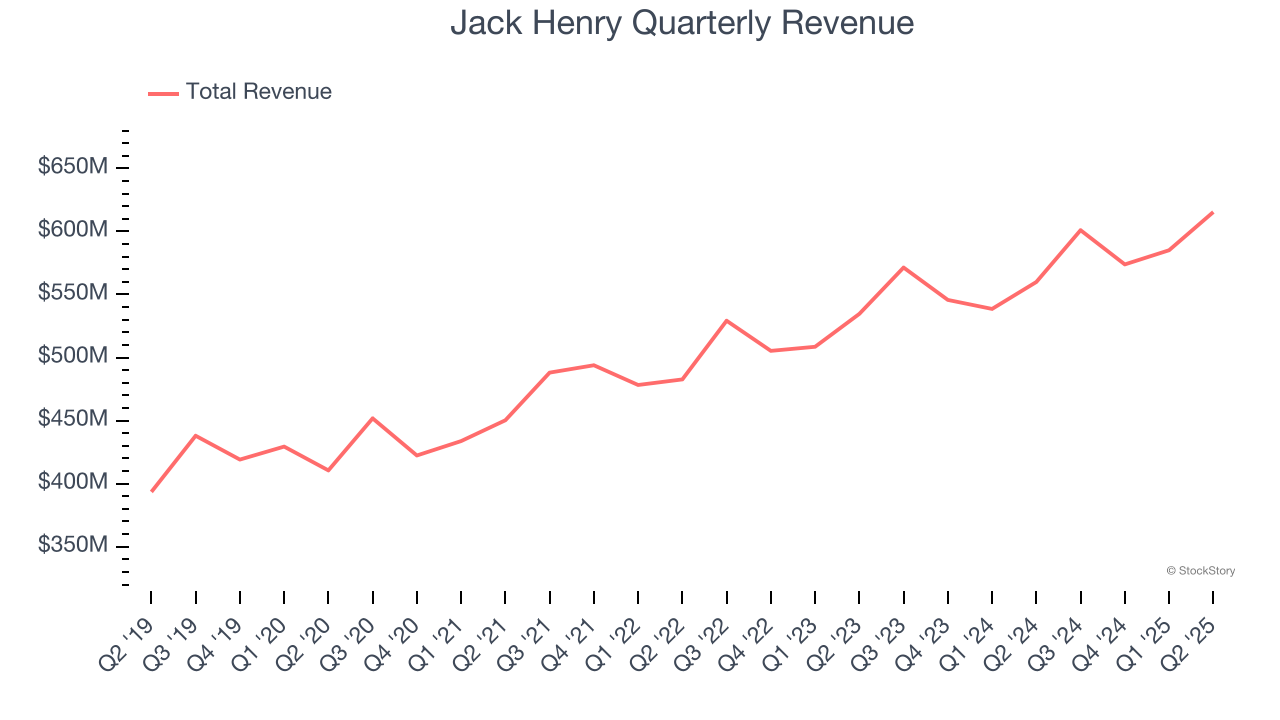
Long-Term Revenue Growth Disappoints
A company’s long-term performance is an indicator of its overall quality. Any business can experience short-term success, but top-performing ones enjoy sustained growth for years.
Over the last five years, Jack Henry grew its revenue at a mediocre 7% compounded annual growth rate. This wasn’t a great result compared to the rest of the financials sector, but there are still things to like about Jack Henry.
Final Judgment
Jack Henry’s merits more than compensate for its flaws. With the recent decline, the stock trades at 24× forward P/E (or $150 per share). Is now the time to initiate a position? See for yourself in our comprehensive research report, it’s free for active Edge members .
High-Quality Stocks for All Market Conditions
Trump’s April 2025 tariff bombshell triggered a massive market selloff, but stocks have since staged an impressive recovery, leaving those who panic sold on the sidelines.
Take advantage of the rebound by checking out our Top 5 Growth Stocks for this month. This is a curated list of our High Quality stocks that have generated a market-beating return of 183% over the last five years (as of March 31st 2025).
Stocks that made our list in 2020 include now familiar names such as Nvidia (+1,545% between March 2020 and March 2025) as well as under-the-radar businesses like the once-small-cap company Exlservice (+354% five-year return). Find your next big winner with StockStory today.
StockStory is growing and hiring equity analyst and marketing roles. Are you a 0 to 1 builder passionate about the markets and AI? See the open roles here.


