
TEGNA has had an impressive run over the past six months as its shares have beaten the S&P 500 by 5.7%. The stock now trades at $20.09, marking a 26.8% gain. This was partly thanks to its solid quarterly results, and the run-up might have investors contemplating their next move.
Is now the time to buy TEGNA, or should you be careful about including it in your portfolio? See what our analysts have to say in our full research report, it’s free for active Edge members.
Why Do We Think TEGNA Will Underperform?
Despite the momentum, we're sitting this one out for now. Here are three reasons you should be careful with TGNA and a stock we'd rather own.
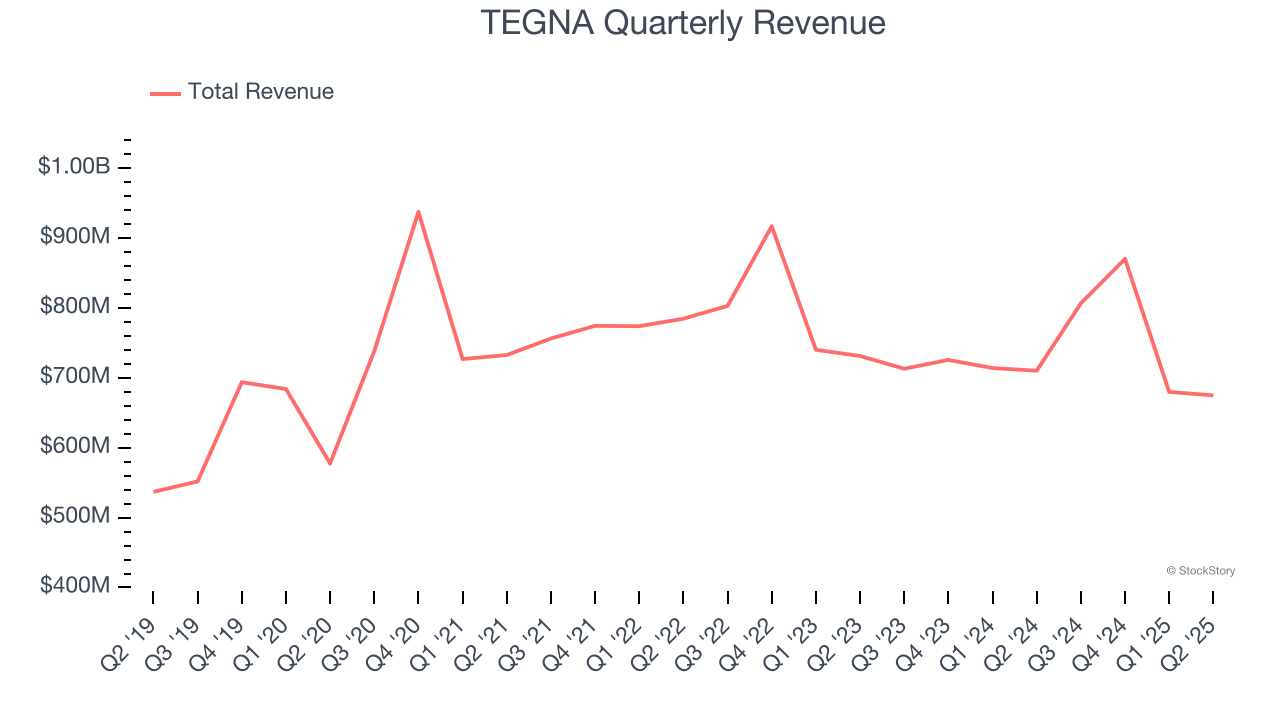
1. Long-Term Revenue Growth Disappoints
Reviewing a company’s long-term sales performance reveals insights into its quality. Any business can have short-term success, but a top-tier one grows for years. Regrettably, TEGNA’s sales grew at a sluggish 3.9% compounded annual growth rate over the last five years. This fell short of our benchmark for the consumer discretionary sector.
2. Revenue Projections Show Stormy Skies Ahead
Forecasted revenues by Wall Street analysts signal a company’s potential. Predictions may not always be accurate, but accelerating growth typically boosts valuation multiples and stock prices while slowing growth does the opposite.
Over the next 12 months, sell-side analysts expect TEGNA’s revenue to drop by 8.5%, a decrease from its 3.9% annualized growth for the past five years. This projection is underwhelming and implies its products and services will face some demand challenges.
3. Cash Flow Margin Set to Decline
Free cash flow isn't a prominently featured metric in company financials and earnings releases, but we think it's telling because it accounts for all operating and capital expenses, making it tough to manipulate. Cash is king.
Over the next year, analysts predict TEGNA’s cash conversion will fall. Their consensus estimates imply its free cash flow margin of 19% for the last 12 months will decrease to 17.6%.
Final Judgment
We see the value of companies helping consumers, but in the case of TEGNA, we’re out. With its shares topping the market in recent months, the stock trades at 10.9× forward P/E (or $20.09 per share). This valuation is reasonable, but the company’s shaky fundamentals present too much downside risk. There are better investments elsewhere. Let us point you toward one of our top software and edge computing picks.
Stocks We Like More Than TEGNA
When Trump unveiled his aggressive tariff plan in April 2025, markets tanked as investors feared a full-blown trade war. But those who panicked and sold missed the subsequent rebound that’s already erased most losses.
Don’t let fear keep you from great opportunities and take a look at Top 6 Stocks for this week. This is a curated list of our High Quality stocks that have generated a market-beating return of 183% over the last five years (as of March 31st 2025).
Stocks that made our list in 2020 include now familiar names such as Nvidia (+1,545% between March 2020 and March 2025) as well as under-the-radar businesses like the once-micro-cap company Tecnoglass (+1,754% five-year return). Find your next big winner with StockStory today.
StockStory is growing and hiring equity analyst and marketing roles. Are you a 0 to 1 builder passionate about the markets and AI? See the open roles here.