
What a fantastic six months it’s been for IPG Photonics. Shares of the company have skyrocketed 45%, hitting $79. This was partly due to its solid quarterly results, and the run-up might have investors contemplating their next move.
Is there a buying opportunity in IPG Photonics, or does it present a risk to your portfolio? Dive into our full research report to see our analyst team’s opinion, it’s free for active Edge members.
Why Do We Think IPG Photonics Will Underperform?
We’re happy investors have made money, but we're cautious about IPG Photonics. Here are three reasons there are better opportunities than IPGP and a stock we'd rather own.
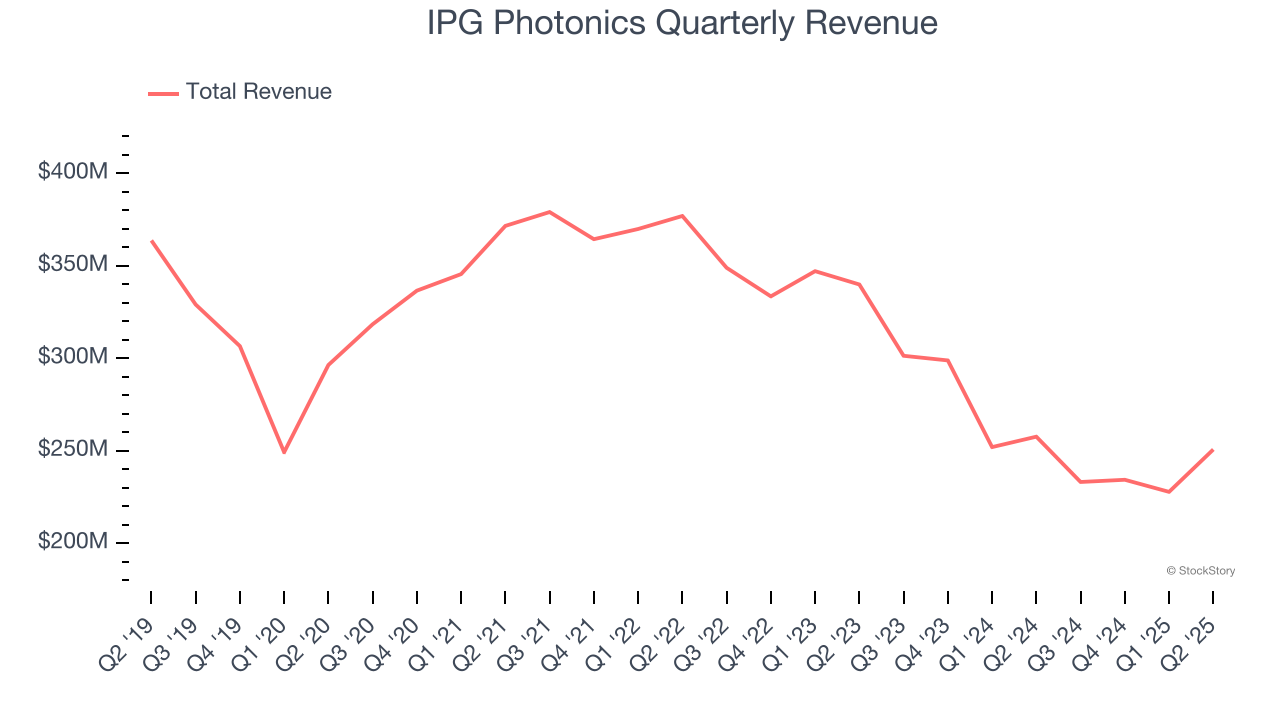
1. Revenue Spiraling Downwards
A company’s long-term sales performance can indicate its overall quality. Even a bad business can shine for one or two quarters, but a top-tier one grows for years. Over the last five years, IPG Photonics’s demand was weak and its revenue declined by 4.3% per year. This was below our standards and is a sign of poor business quality. Semiconductors are a cyclical industry, and long-term investors should be prepared for periods of high growth followed by periods of revenue contractions.
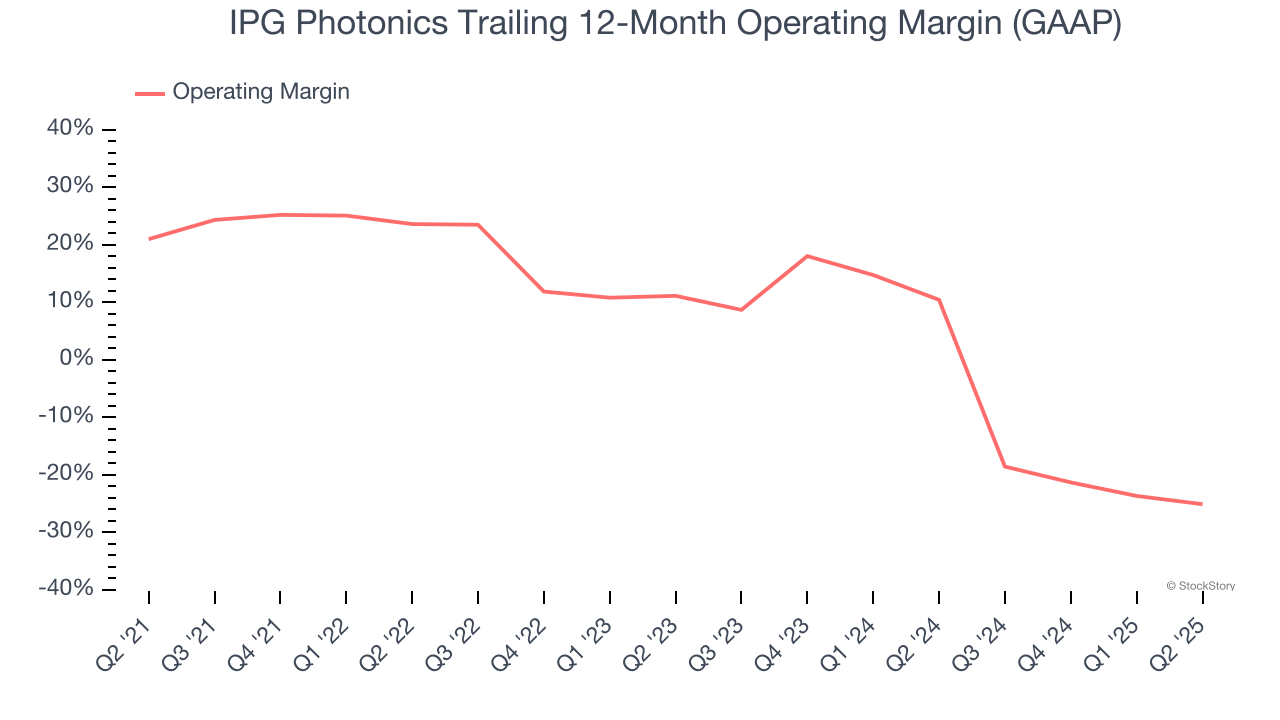
2. Shrinking Operating Margin
Operating margin is one of the best measures of profitability because it tells us how much money a company takes home after procuring and manufacturing its products, marketing and selling those products, and most importantly, keeping them relevant through research and development.
Looking at the trend in its profitability, IPG Photonics’s operating margin decreased by 46.1 percentage points over the last five years. IPG Photonics’s performance was poor no matter how you look at it - it shows that costs were rising and it couldn’t pass them onto its customers. Its operating margin for the trailing 12 months was negative 25.1%.
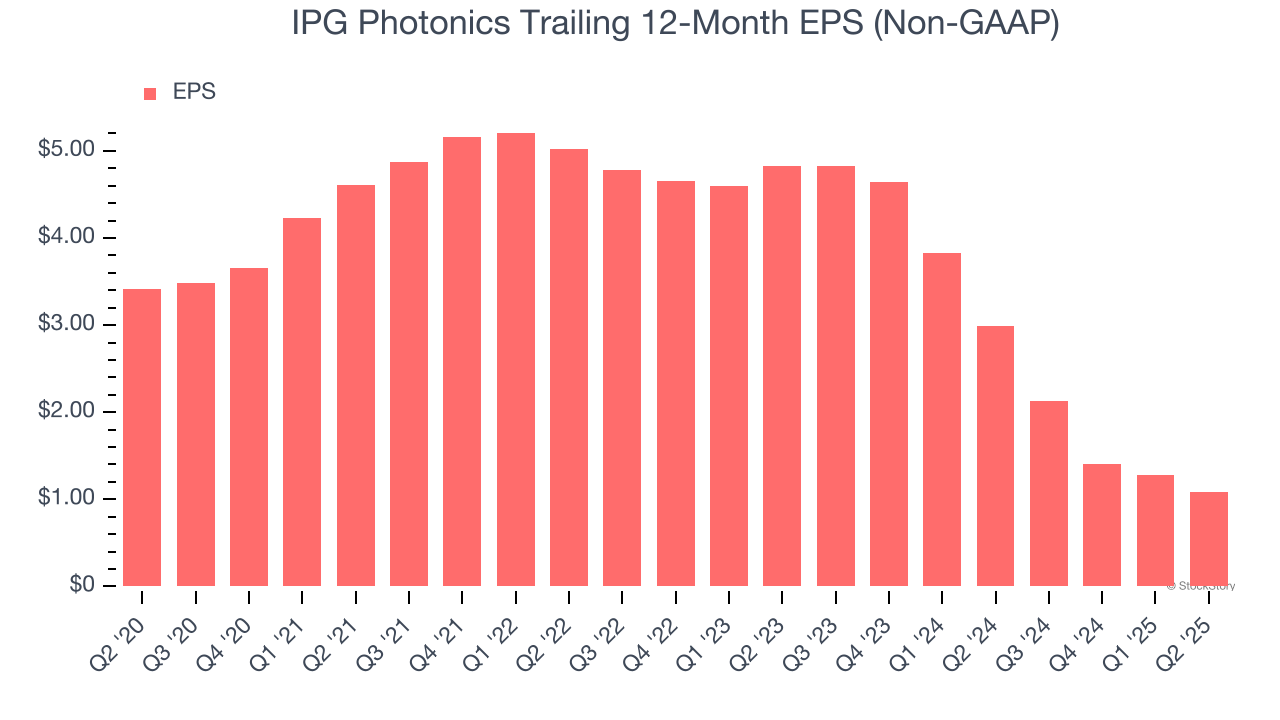
3. EPS Trending Down
Analyzing the long-term change in earnings per share (EPS) shows whether a company's incremental sales were profitable – for example, revenue could be inflated through excessive spending on advertising and promotions.
Sadly for IPG Photonics, its EPS declined by 20.5% annually over the last five years, more than its revenue. This tells us the company struggled because its fixed cost base made it difficult to adjust to shrinking demand.
Final Judgment
IPG Photonics doesn’t pass our quality test. Following the recent rally, the stock trades at 66.4× forward P/E (or $79 per share). This valuation tells us it’s a bit of a market darling with a lot of good news priced in - you can find more timely opportunities elsewhere. Let us point you toward a safe-and-steady industrials business benefiting from an upgrade cycle.
Stocks We Like More Than IPG Photonics
Donald Trump’s April 2025 "Liberation Day" tariffs sent markets into a tailspin, but stocks have since rebounded strongly, proving that knee-jerk reactions often create the best buying opportunities.
The smart money is already positioning for the next leg up. Don’t miss out on the recovery - check out our Top 6 Stocks for this week. This is a curated list of our High Quality stocks that have generated a market-beating return of 183% over the last five years (as of March 31st 2025).
Stocks that made our list in 2020 include now familiar names such as Nvidia (+1,545% between March 2020 and March 2025) as well as under-the-radar businesses like the once-small-cap company Exlservice (+354% five-year return). Find your next big winner with StockStory today.
StockStory is growing and hiring equity analyst and marketing roles. Are you a 0 to 1 builder passionate about the markets and AI? See the open roles here.


