While the S&P 500 is up 22.9% since April 2025, Limbach (currently trading at $92.13 per share) has lagged behind, posting a return of 14.9%. This may have investors wondering how to approach the situation.
Does this present a buying opportunity for LMB? Or does the price properly account for its business quality and fundamentals?
Why Does Limbach Spark Debate?
Established in 1901, Limbach (NASDAQ: LMB) provides integrated building systems solutions, including mechanical, electrical, and plumbing services.
Two Positive Attributes:
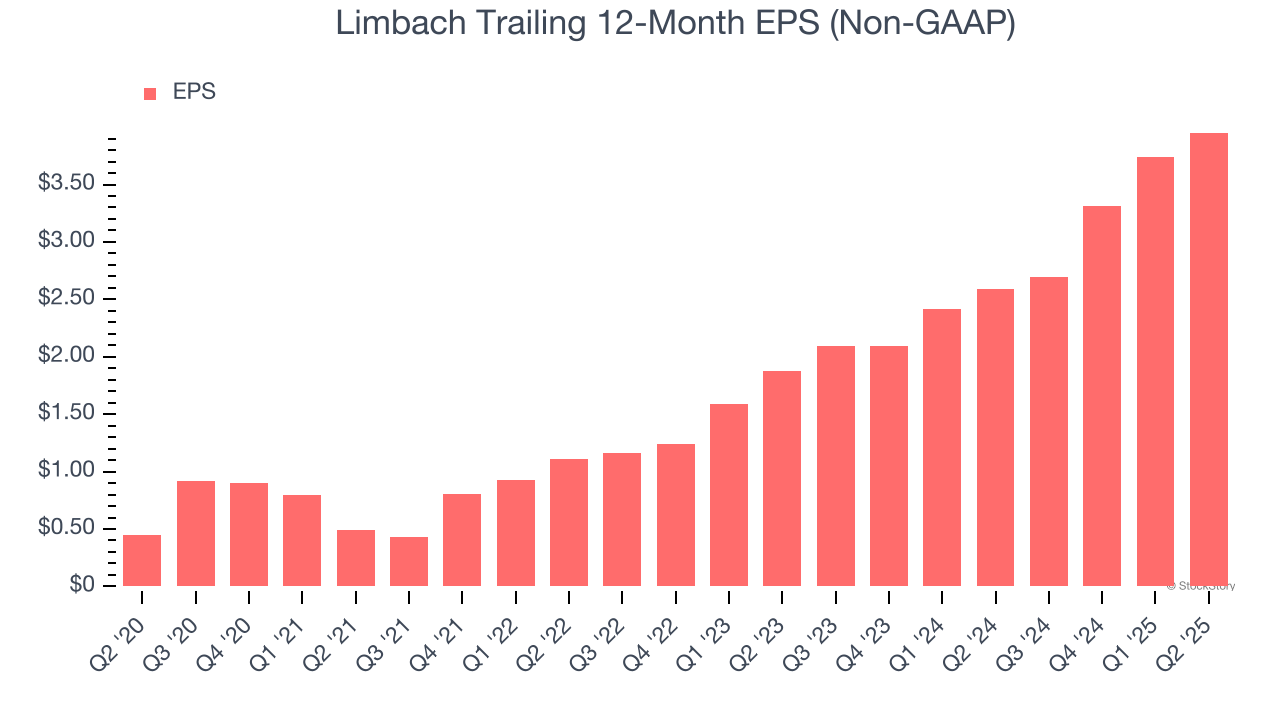
1. Outstanding Long-Term EPS Growth
Analyzing the long-term change in earnings per share (EPS) shows whether a company's incremental sales were profitable – for example, revenue could be inflated through excessive spending on advertising and promotions.
Limbach’s EPS grew at an astounding 54.4% compounded annual growth rate over the last five years, higher than its flat revenue. This tells us management responded to softer demand by adapting its cost structure.
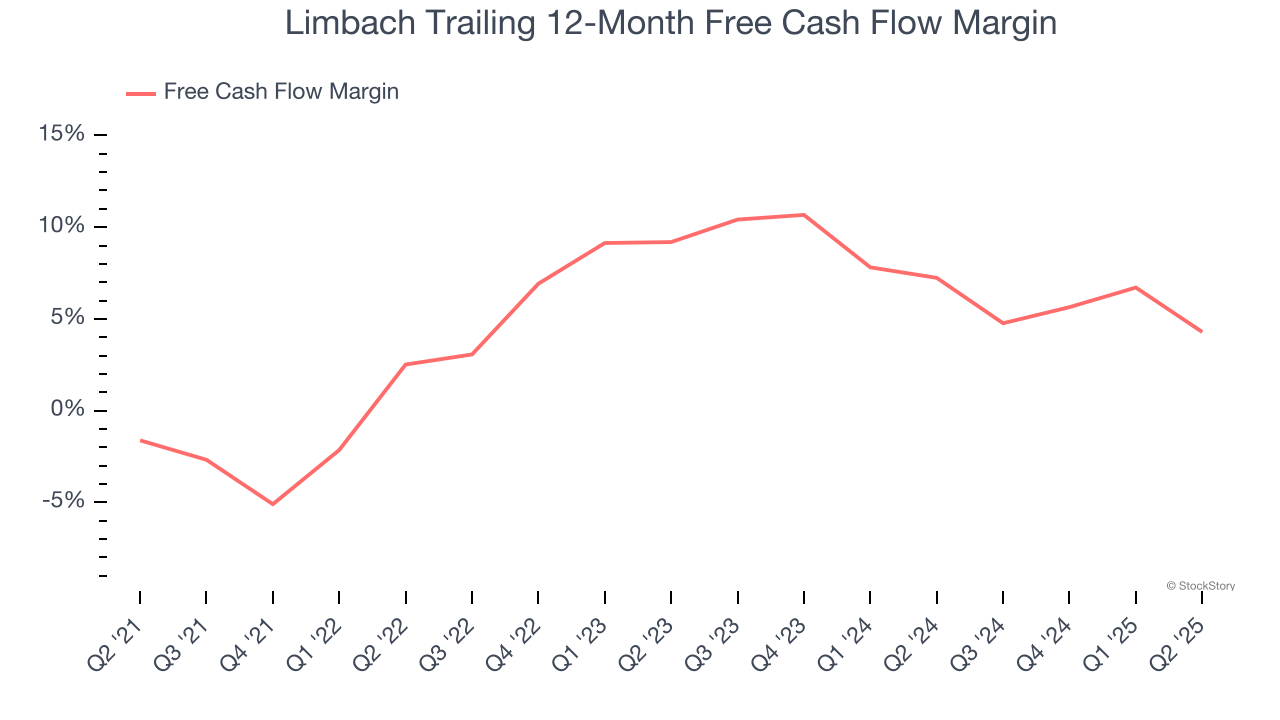
2. Increasing Free Cash Flow Margin Juices Financials
Free cash flow isn't a prominently featured metric in company financials and earnings releases, but we think it's telling because it accounts for all operating and capital expenses, making it tough to manipulate. Cash is king.
As you can see below, Limbach’s margin expanded by 5.9 percentage points over the last five years. We have no doubt shareholders would like to continue seeing its cash conversion rise as it gives the company more optionality. Limbach’s free cash flow margin for the trailing 12 months was 4.3%.
One Reason to be Careful:
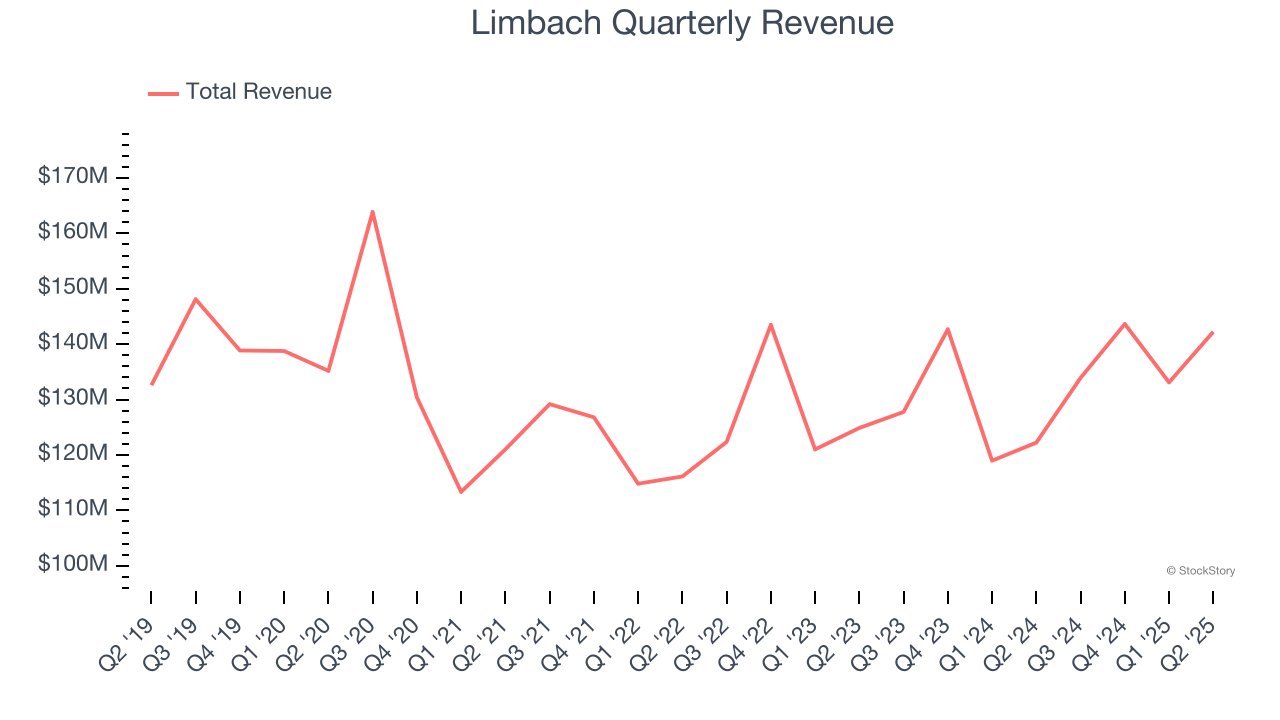
Long-Term Revenue Growth Flatter Than a Pancake
A company’s long-term sales performance is one signal of its overall quality. Any business can put up a good quarter or two, but the best consistently grow over the long haul. Unfortunately, Limbach struggled to consistently increase demand as its $552.9 million of sales for the trailing 12 months was close to its revenue five years ago. This wasn’t a great result, but there are still things to like about Limbach.
Final Judgment
Limbach’s positive characteristics outweigh the negatives. With its shares underperforming the market lately, the stock trades at 21.4× forward P/E (or $92.13 per share). Is now a good time to buy? See for yourself in our full research report, it’s free for active Edge members.
High-Quality Stocks for All Market Conditions
When Trump unveiled his aggressive tariff plan in April 2025, markets tanked as investors feared a full-blown trade war. But those who panicked and sold missed the subsequent rebound that’s already erased most losses.
Don’t let fear keep you from great opportunities and take a look at Top 5 Growth Stocks for this month. This is a curated list of our High Quality stocks that have generated a market-beating return of 183% over the last five years (as of March 31st 2025).
Stocks that made our list in 2020 include now familiar names such as Nvidia (+1,545% between March 2020 and March 2025) as well as under-the-radar businesses like the once-small-cap company Exlservice (+354% five-year return). Find your next big winner with StockStory today.
StockStory is growing and hiring equity analyst and marketing roles. Are you a 0 to 1 builder passionate about the markets and AI? See the open roles here.