
Although Navient (currently trading at $12.18 per share) has gained 8.9% over the last six months, it has trailed the S&P 500’s 22.9% return during that period. This was partly due to its softer quarterly results and may have investors wondering how to approach the situation.
Is there a buying opportunity in Navient, or does it present a risk to your portfolio? Get the full breakdown from our expert analysts, it’s free for active Edge members.
Why Do We Think Navient Will Underperform?
We're cautious about Navient. Here are three reasons why NAVI doesn't excite us and a stock we'd rather own.
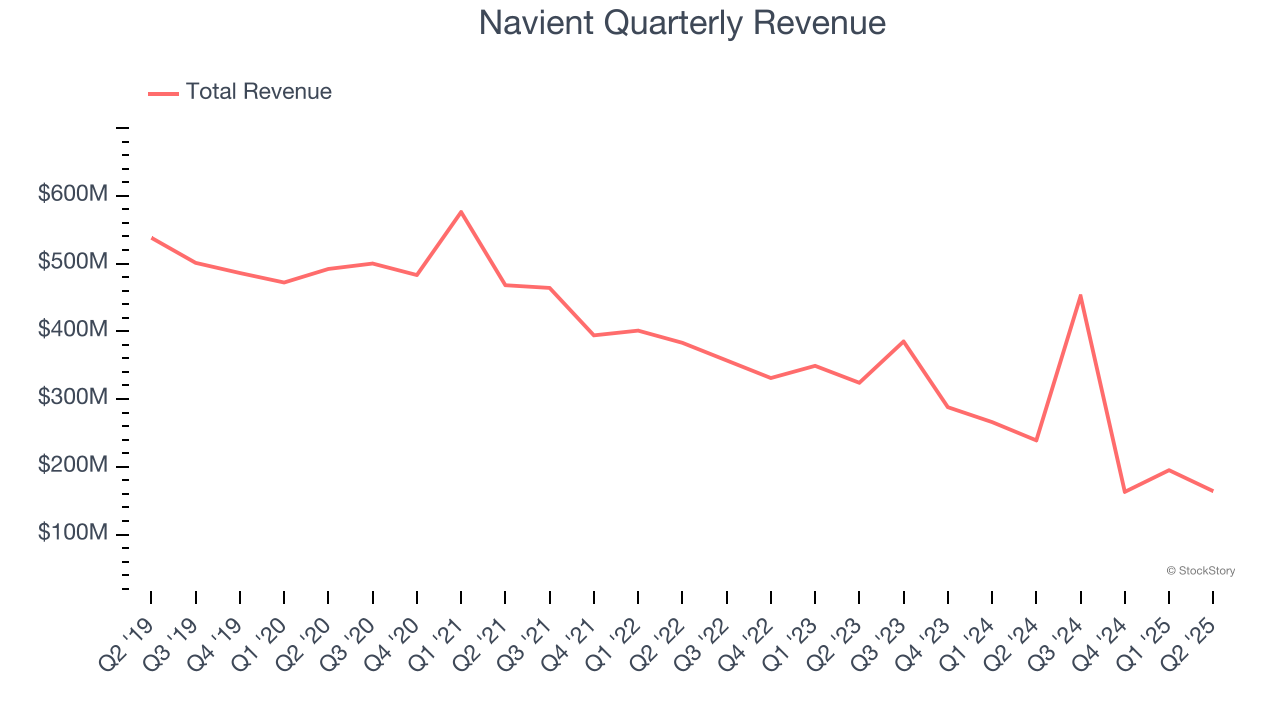
1. Revenue Spiraling Downwards
Reviewing a company’s long-term sales performance reveals insights into its quality. Any business can have short-term success, but a top-tier one grows for years.
Navient’s demand was weak over the last five years as its revenue fell at a 13% annual rate. This wasn’t a great result and signals it’s a low quality business.
2. EPS Trending Down
We track the long-term change in earnings per share (EPS) because it highlights whether a company’s growth is profitable.
Sadly for Navient, its EPS declined by 36.8% annually over the last five years, more than its revenue. This tells us the company struggled because its fixed cost base made it difficult to adjust to shrinking demand.

The debt-to-equity ratio is a widely used measure to assess a company's balance sheet health. A higher ratio means that a business aggressively financed its growth with debt. This can result in higher earnings (if the borrowed funds are invested profitably) but also increases risk.
If debt levels are too high, there could be difficulties in meeting obligations, especially during economic downturns or periods of rising interest rates if the debt has variable-rate payments.
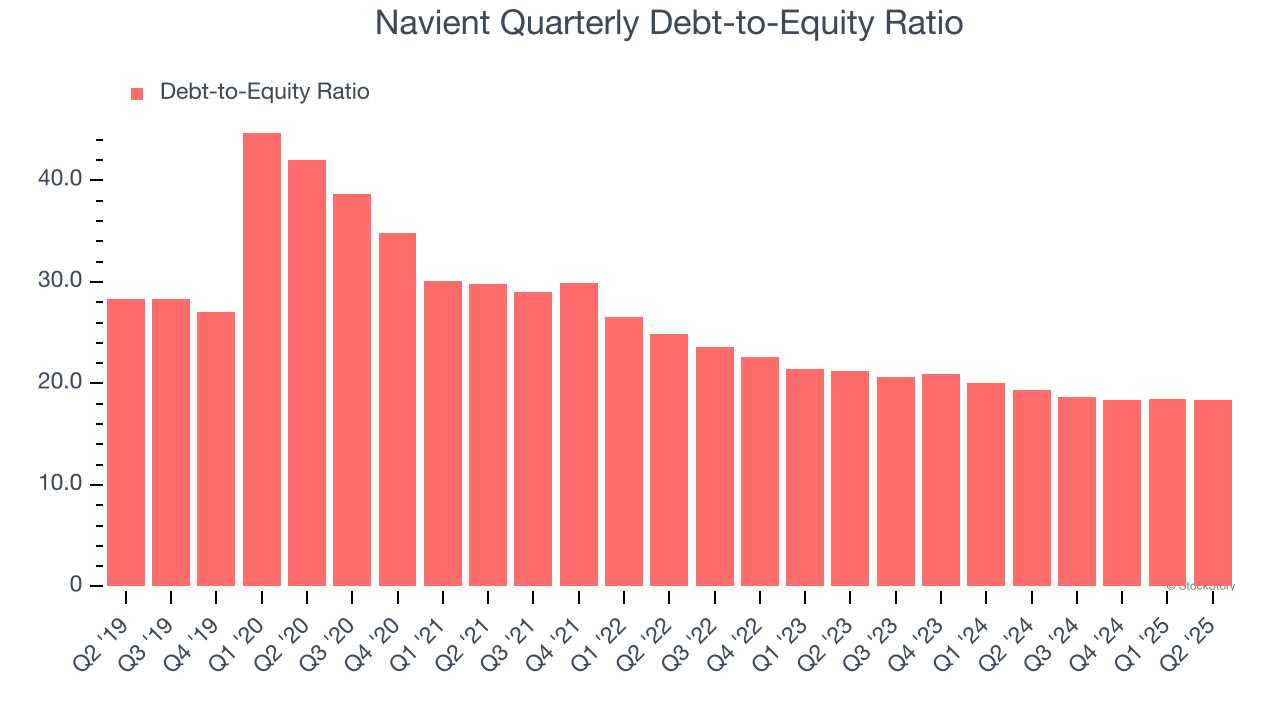
Navient currently has $47.18 billion of debt and $2.56 billion of shareholder's equity on its balance sheet, and over the past four quarters, has averaged a debt-to-equity ratio of 18.5×. We think this is dangerous - for a financials business, anything above 3.5× raises red flags.
Final Judgment
We see the value of companies driving economic growth, but in the case of Navient, we’re out. With its shares trailing the market in recent months, the stock trades at 10.2× forward P/E (or $12.18 per share). This multiple tells us a lot of good news is priced in - we think there are better stocks to buy right now. Let us point you toward one of our top digital advertising picks.
High-Quality Stocks for All Market Conditions
Donald Trump’s April 2025 "Liberation Day" tariffs sent markets into a tailspin, but stocks have since rebounded strongly, proving that knee-jerk reactions often create the best buying opportunities.
The smart money is already positioning for the next leg up. Don’t miss out on the recovery - check out our Top 5 Strong Momentum Stocks for this week. This is a curated list of our High Quality stocks that have generated a market-beating return of 183% over the last five years (as of March 31st 2025).
Stocks that made our list in 2020 include now familiar names such as Nvidia (+1,545% between March 2020 and March 2025) as well as under-the-radar businesses like the once-micro-cap company Tecnoglass (+1,754% five-year return). Find your next big winner with StockStory today.
StockStory is growing and hiring equity analyst and marketing roles. Are you a 0 to 1 builder passionate about the markets and AI? See the open roles here.