Procore Technologies trades at $71.77 per share and has stayed right on track with the overall market, gaining 18.6% over the last six months. At the same time, the S&P 500 has returned 22.9%.
Is there a buying opportunity in Procore Technologies, or does it present a risk to your portfolio? Dive into our full research report to see our analyst team’s opinion, it’s free for active Edge members.
Why Is Procore Technologies Not Exciting?
We're sitting this one out for now. Here are three reasons you should be careful with PCOR and a stock we'd rather own.
1. Weak Billings Point to Soft Demand
Billings is a non-GAAP metric that is often called “cash revenue” because it shows how much money the company has collected from customers in a certain period. This is different from revenue, which must be recognized in pieces over the length of a contract.
Procore Technologies’s billings came in at $323.5 million in Q2, and over the last four quarters, its year-on-year growth averaged 13.7%. This performance slightly lagged the sector and suggests that increasing competition is causing challenges in acquiring/retaining customers. 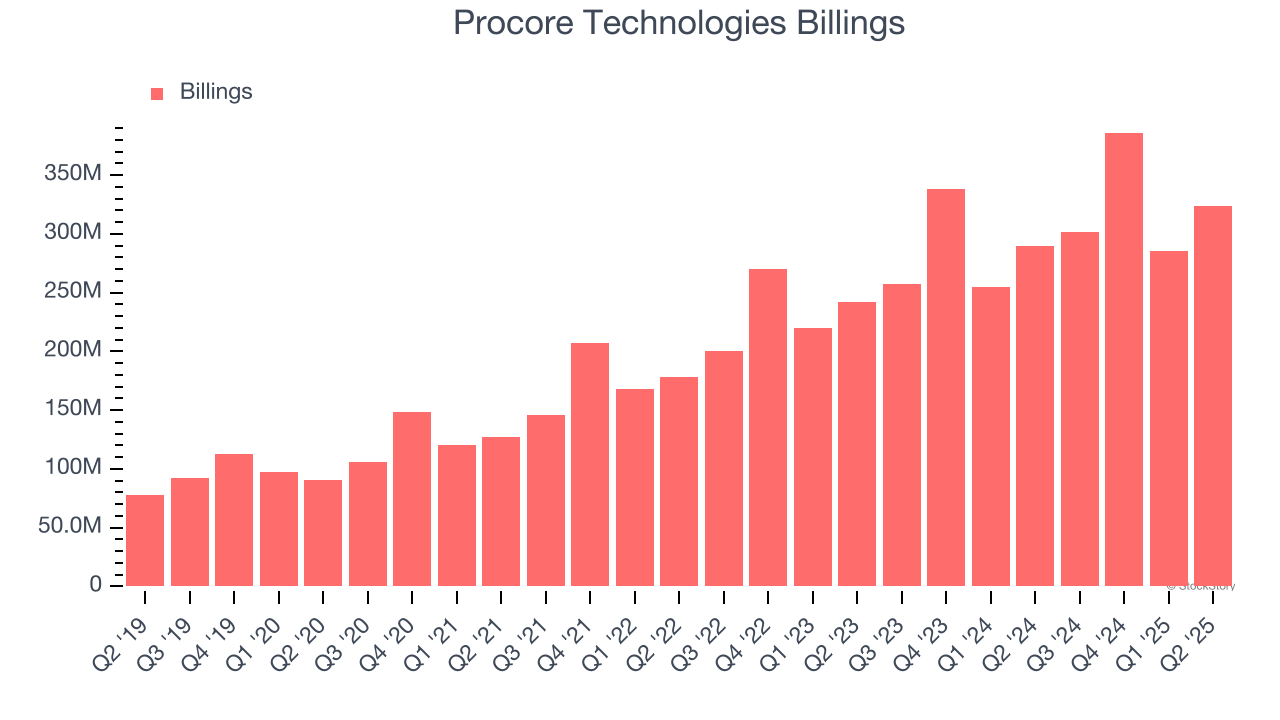
2. Shrinking Operating Margin
While many software businesses point investors to their adjusted profits, which exclude stock-based compensation (SBC), we prefer GAAP operating margin because SBC is a legitimate expense used to attract and retain talent. This is one of the best measures of profitability because it shows how much money a company takes home after developing, marketing, and selling its products.
Looking at the trend in its profitability, Procore Technologies’s operating margin decreased by 2.3 percentage points over the last two years. This raises questions about the company’s expense base because its revenue growth should have given it leverage on its fixed costs, resulting in better economies of scale and profitability. Procore Technologies’s performance was poor no matter how you look at it - it shows that costs were rising and it couldn’t pass them onto its customers. Its operating margin for the trailing 12 months was negative 13.7%.

3. Mediocre Free Cash Flow Margin Limits Reinvestment Potential
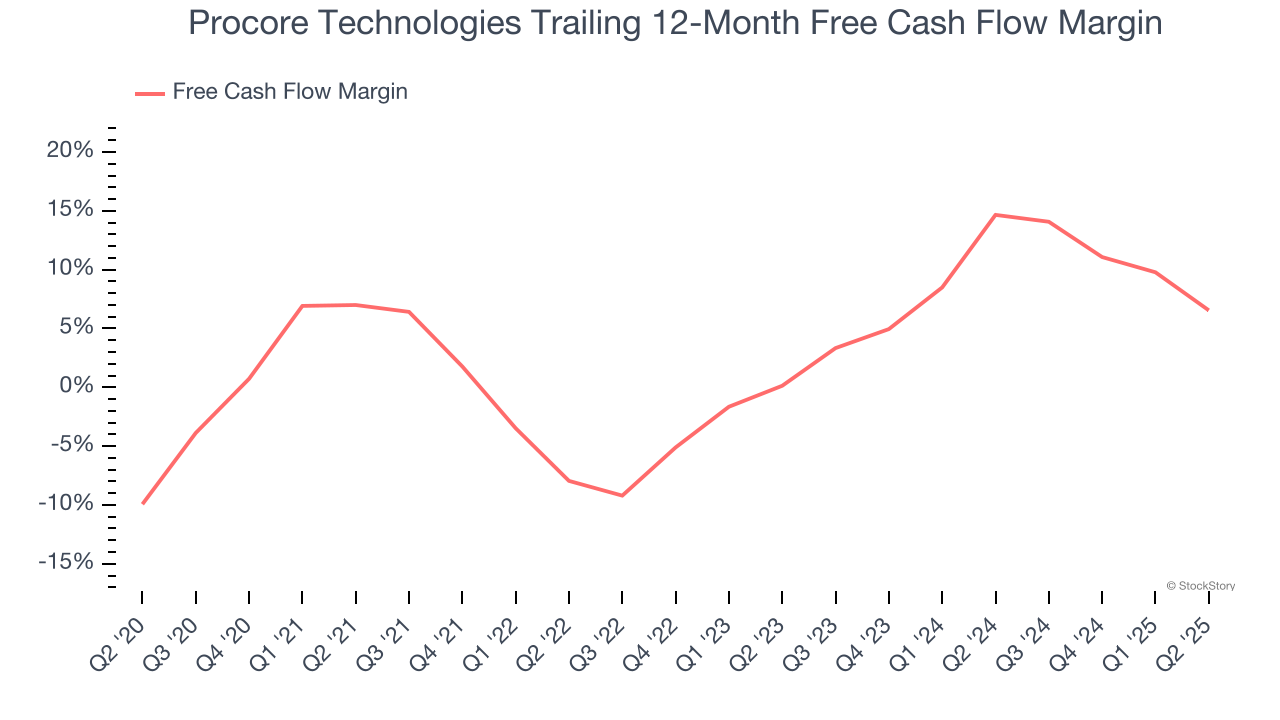
If you’ve followed StockStory for a while, you know we emphasize free cash flow. Why, you ask? We believe that in the end, cash is king, and you can’t use accounting profits to pay the bills.
Procore Technologies has shown weak cash profitability over the last year, giving the company limited opportunities to return capital to shareholders. Its free cash flow margin averaged 6.5%, subpar for a software business.
Final Judgment
Procore Technologies isn’t a terrible business, but it doesn’t pass our quality test. That said, the stock currently trades at 7.8× forward price-to-sales (or $71.77 per share). Beauty is in the eye of the beholder, but we don’t really see a big opportunity at the moment. We're fairly confident there are better investments elsewhere. We’d recommend looking at the Amazon and PayPal of Latin America.
Stocks We Would Buy Instead of Procore Technologies
Trump’s April 2025 tariff bombshell triggered a massive market selloff, but stocks have since staged an impressive recovery, leaving those who panic sold on the sidelines.
Take advantage of the rebound by checking out our Top 6 Stocks for this week. This is a curated list of our High Quality stocks that have generated a market-beating return of 183% over the last five years (as of March 31st 2025).
Stocks that made our list in 2020 include now familiar names such as Nvidia (+1,545% between March 2020 and March 2025) as well as under-the-radar businesses like the once-micro-cap company Kadant (+351% five-year return). Find your next big winner with StockStory today.
StockStory is growing and hiring equity analyst and marketing roles. Are you a 0 to 1 builder passionate about the markets and AI? See the open roles here.