Since April 2025, Reynolds has been in a holding pattern, posting a small loss of 2.5% while floating around $23.36. The stock also fell short of the S&P 500’s 22.9% gain during that period.
Is there a buying opportunity in Reynolds, or does it present a risk to your portfolio? Dive into our full research report to see our analyst team’s opinion, it’s free for active Edge members.
Why Do We Think Reynolds Will Underperform?
We're cautious about Reynolds. Here are three reasons we avoid REYN and a stock we'd rather own.
1. Demand Slipping as Sales Volumes Decline
Revenue growth can be broken down into changes in price and volume (the number of units sold). While both are important, volume is the lifeblood of a successful staples business as there’s a ceiling to what consumers will pay for everyday goods; they can always trade down to non-branded products if the branded versions are too expensive.
Reynolds’s average quarterly sales volumes have shrunk by 1.9% over the last two years. This decrease isn’t ideal because the quantity demanded for consumer staples products is typically stable. 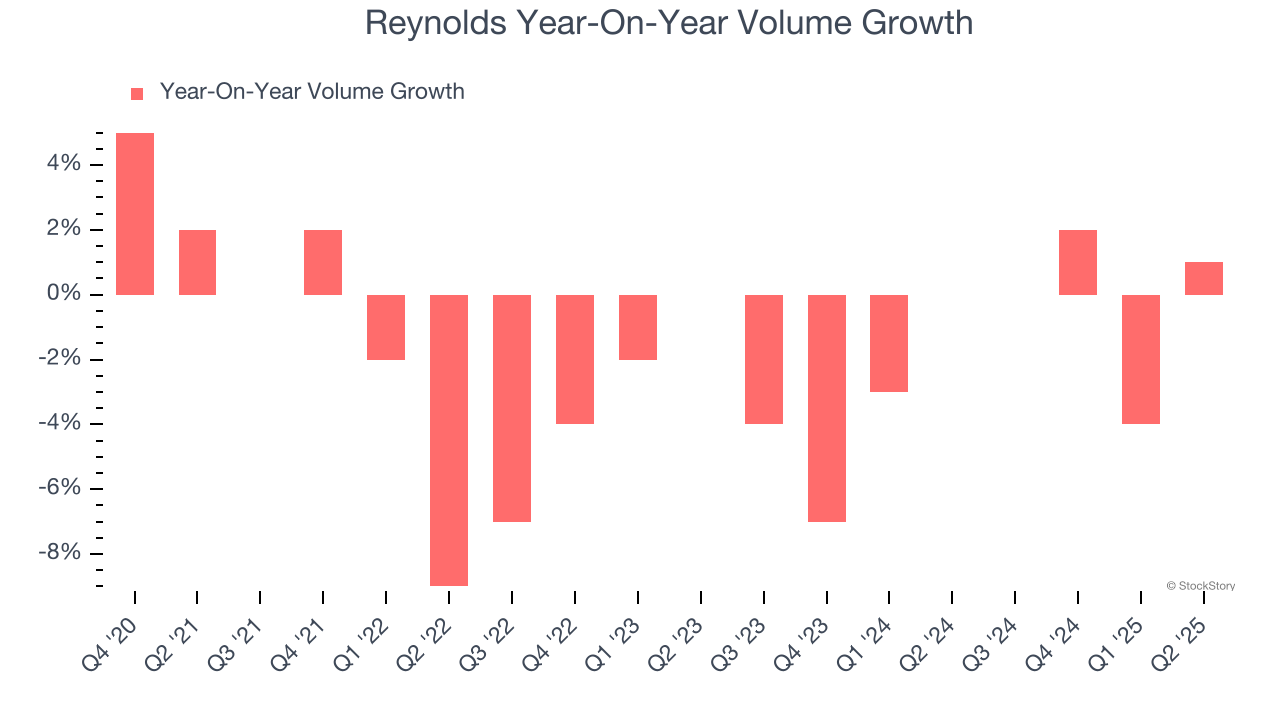
2. Projected Revenue Growth Shows Limited Upside
Forecasted revenues by Wall Street analysts signal a company’s potential. Predictions may not always be accurate, but accelerating growth typically boosts valuation multiples and stock prices while slowing growth does the opposite.
Over the next 12 months, sell-side analysts expect Reynolds’s revenue to stall, close to This projection is underwhelming and implies its newer products will not catalyze better top-line performance yet.
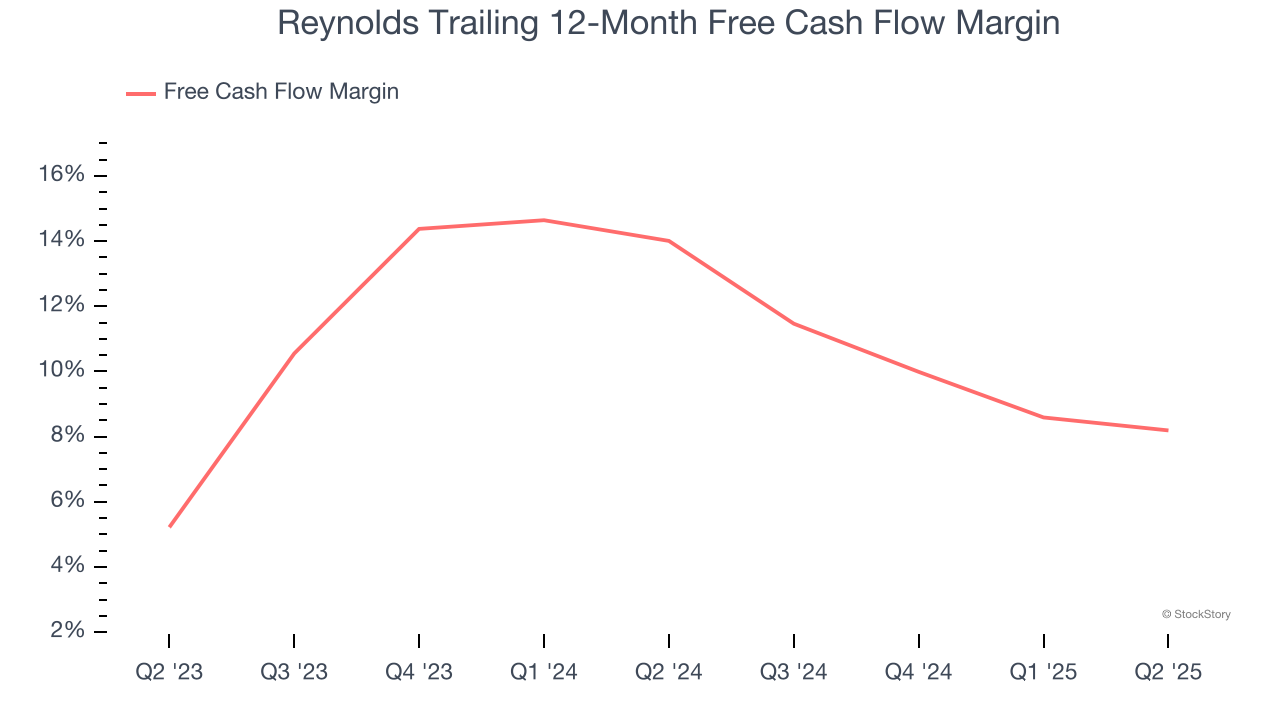
3. Free Cash Flow Margin Dropping
If you’ve followed StockStory for a while, you know we emphasize free cash flow. Why, you ask? We believe that in the end, cash is king, and you can’t use accounting profits to pay the bills.
As you can see below, Reynolds’s margin dropped by 5.8 percentage points over the last year. This decrease warrants extra caution because Reynolds failed to grow its revenue organically. Its cash profitability could decay further if it tries to reignite growth through investments.
Final Judgment
Reynolds falls short of our quality standards. With its shares lagging the market recently, the stock trades at 14.6× forward P/E (or $23.36 per share). This valuation multiple is fair, but we don’t have much confidence in the company. There are superior stocks to buy right now. We’d suggest looking at an all-weather company that owns household favorite Taco Bell.
High-Quality Stocks for All Market Conditions
When Trump unveiled his aggressive tariff plan in April 2025, markets tanked as investors feared a full-blown trade war. But those who panicked and sold missed the subsequent rebound that’s already erased most losses.
Don’t let fear keep you from great opportunities and take a look at Top 6 Stocks for this week. This is a curated list of our High Quality stocks that have generated a market-beating return of 183% over the last five years (as of March 31st 2025).
Stocks that made our list in 2020 include now familiar names such as Nvidia (+1,545% between March 2020 and March 2025) as well as under-the-radar businesses like the once-micro-cap company Kadant (+351% five-year return). Find your next big winner with StockStory today.
StockStory is growing and hiring equity analyst and marketing roles. Are you a 0 to 1 builder passionate about the markets and AI? See the open roles here.