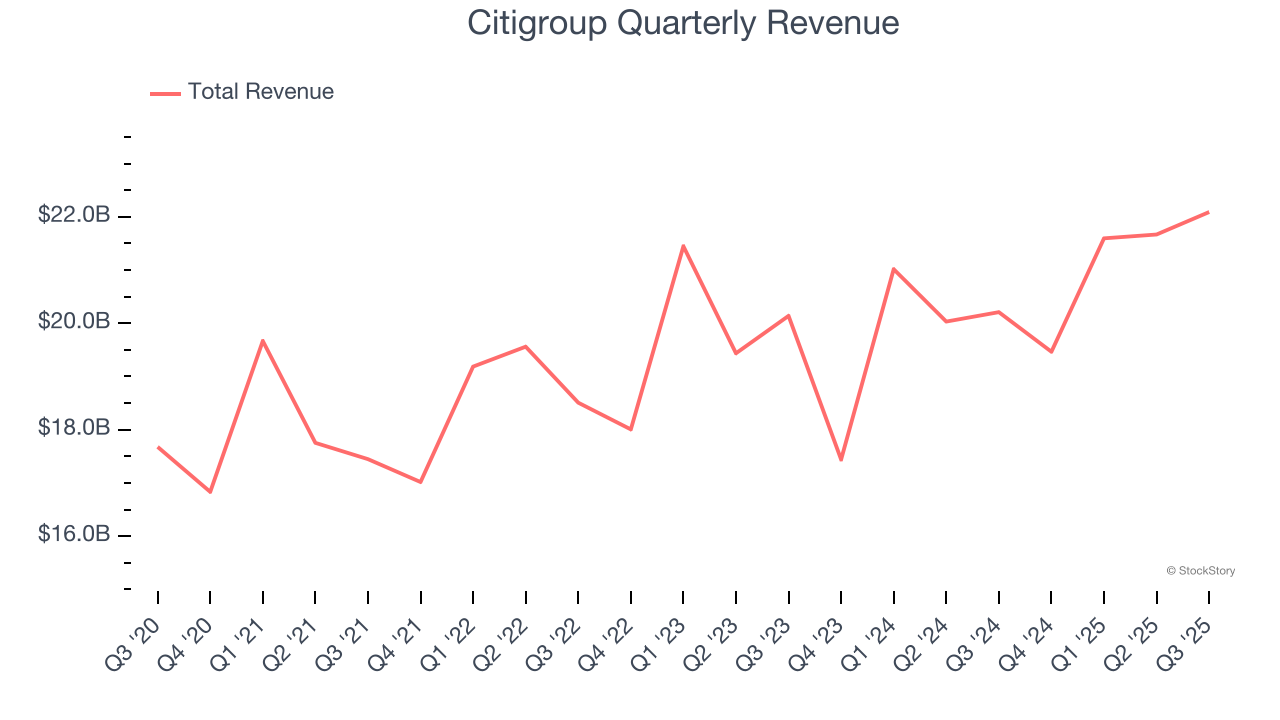
Global financial services giant Citigroup (NYSE: C) announced better-than-expected revenue in Q3 CY2025, with sales up 9.3% year on year to $22.09 billion. Its GAAP profit of $1.86 per share was 8% above analysts’ consensus estimates.
Is now the time to buy Citigroup? Find out by accessing our full research report, it’s free for active Edge members.
Citigroup (C) Q3 CY2025 Highlights:
- Revenue: $22.09 billion vs analyst estimates of $21.11 billion (9.3% year-on-year growth, 4.6% beat)
- EPS (GAAP): $1.86 vs analyst estimates of $1.72 (8% beat)
- Tangible Book Value per Share: $95.72 vs analyst estimates of $95.50 (6.7% year-on-year growth, in line)
- Market Capitalization: $176.9 billion
Company Overview
With operations in nearly 160 countries and a history dating back to 1812, Citigroup (NYSE: C) is a global financial services company that provides banking, investment, wealth management, and payment solutions to consumers, corporations, and governments.
Sales Growth
In general, banks make money from two primary sources. The first is net interest income, which is interest earned on loans, mortgages, and investments in securities minus interest paid out on deposits. The second source is non-interest income, which can come from bank account, credit card, wealth management, investing banking, and trading fees. Unfortunately, Citigroup’s 1.9% annualized revenue growth over the last five years was tepid. This fell short of our benchmarks and is a poor baseline for our analysis.
We at StockStory place the most emphasis on long-term growth, but within financials, a half-decade historical view may miss recent interest rate changes, market returns, and industry trends. Citigroup’s annualized revenue growth of 3.6% over the last two years is above its five-year trend, but we were still disappointed by the results. 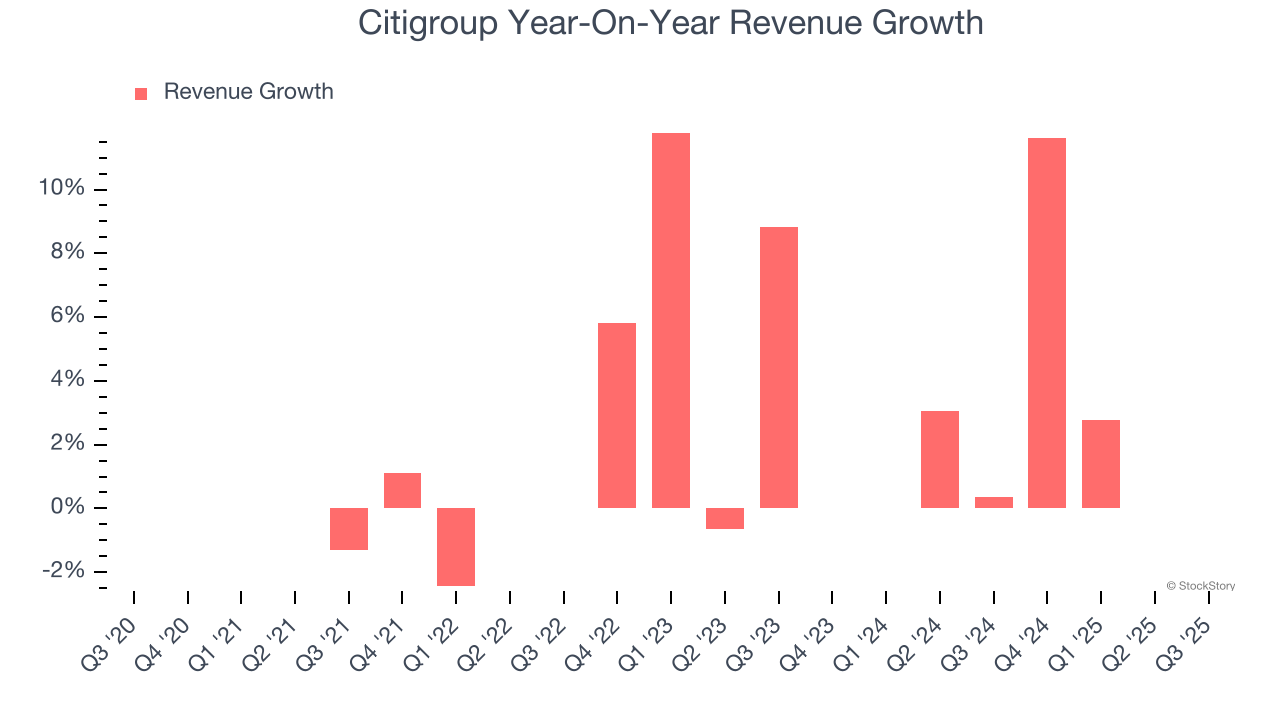 Note: Quarters not shown were determined to be outliers, impacted by outsized investment gains/losses that are not indicative of the recurring fundamentals of the business.
This quarter, Citigroup reported year-on-year revenue growth of 9.3%, and its $22.09 billion of revenue exceeded Wall Street’s estimates by 4.6%.
Net interest income made up 65.1% of the company’s total revenue during the last five years, meaning lending operations are Citigroup’s largest source of revenue.
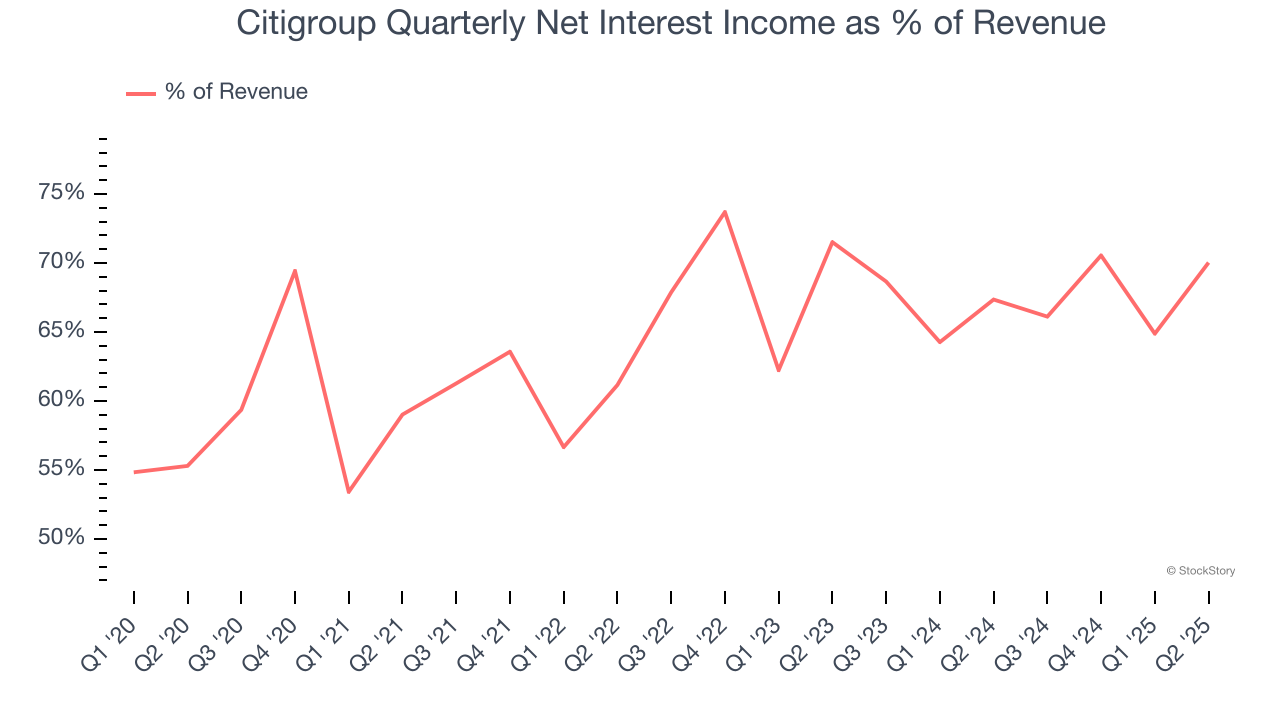
Markets consistently prioritize net interest income growth over fee-based revenue, recognizing its superior quality and recurring nature compared to the more unpredictable non-interest income streams.
Unless you’ve been living under a rock, it should be obvious by now that generative AI is going to have a huge impact on how large corporations do business. While Nvidia and AMD are trading close to all-time highs, we prefer a lesser-known (but still profitable) stock benefiting from the rise of AI. Click here to access our free report one of our favorites growth stories.
Tangible Book Value Per Share (TBVPS)
Banks operate as balance sheet businesses, with profits generated through borrowing and lending activities. Valuations reflect this reality, emphasizing balance sheet strength and long-term book value compounding ability.
This explains why tangible book value per share (TBVPS) stands as the premier banking metric. TBVPS strips away questionable intangible assets, revealing concrete per-share net worth that investors can trust. On the other hand, EPS is often distorted by mergers and flexible loan loss accounting. TBVPS provides clearer performance insights.
Citigroup’s TBVPS grew at a decent 5.9% annual clip over the last five years. The last two years show a similar trajectory as TBVPS grew by 4.9% annually from $86.93 to $95.72 per share.
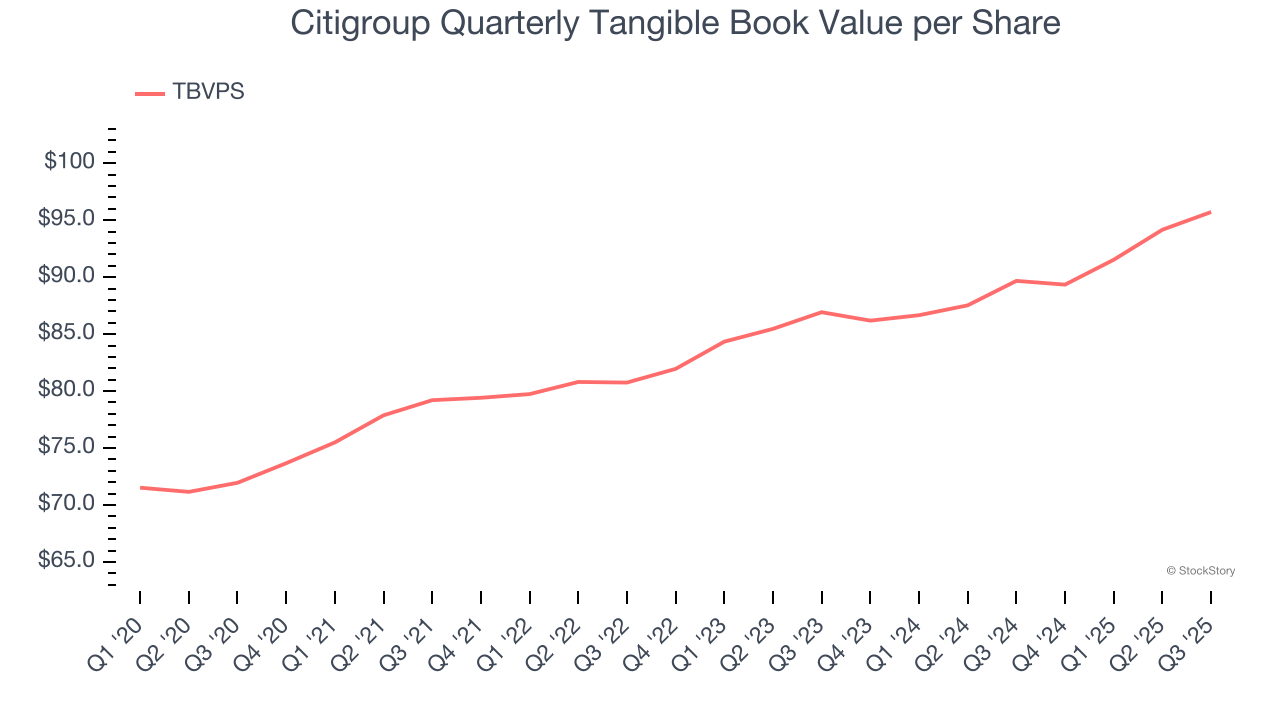
Over the next 12 months, Consensus estimates call for Citigroup’s TBVPS to grow by 8.1% to $103.46, decent growth rate.
Key Takeaways from Citigroup’s Q3 Results
We enjoyed seeing Citigroup beat analysts’ revenue expectations this quarter. We were also glad its EPS outperformed Wall Street’s estimates. Overall, we think this was a solid quarter with some key areas of upside. The stock remained flat at $96.98 immediately after reporting.
Citigroup may have had a good quarter, but does that mean you should invest right now? If you’re making that decision, you should consider the bigger picture of valuation, business qualities, as well as the latest earnings. We cover that in our actionable full research report which you can read here, it’s free for active Edge members.