
Fast-food pizza chain Domino’s (NYSE: DPZ) reported revenue ahead of Wall Street’s expectations in Q3 CY2025, with sales up 6.2% year on year to $1.15 billion. Its GAAP profit of $4.08 per share was 3.1% above analysts’ consensus estimates.
Is now the time to buy Domino's? Find out by accessing our full research report, it’s free for active Edge members.
Domino's (DPZ) Q3 CY2025 Highlights:
- Revenue: $1.15 billion vs analyst estimates of $1.14 billion (6.2% year-on-year growth, 0.9% beat)
- EPS (GAAP): $4.08 vs analyst estimates of $3.96 (3.1% beat)
- Adjusted EBITDA: $253.9 million vs analyst estimates of $235.5 million (22.1% margin, 7.8% beat)
- Operating Margin: 19.5%, up from 18.4% in the same quarter last year
- Free Cash Flow Margin: 14.3%, similar to the same quarter last year
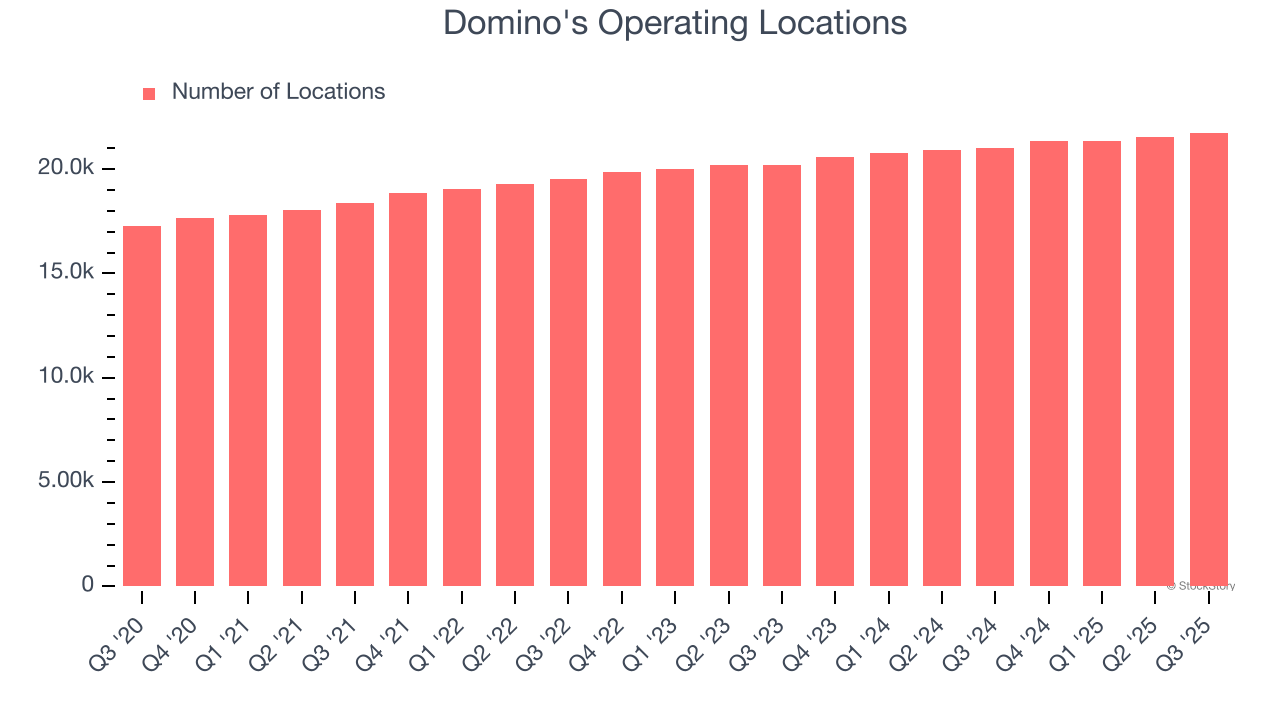
- Locations: 21,750 at quarter end, up from 21,002 in the same quarter last year
- Same-Store Sales rose 5.2% year on year (1.9% in the same quarter last year)
- Market Capitalization: $13.86 billion
"I am incredibly proud of how our team and franchise system is bringing our Hungry for MORE strategy to life and delivering best in class results," said Russell Weiner, Domino's Chief Executive Officer.
Company Overview
Founded by two brothers in Michigan, Domino’s (NYSE: DPZ) is a globally recognized pizza chain known for its creative marketing and fast delivery.
Revenue Growth
A company’s long-term performance is an indicator of its overall quality. Any business can experience short-term success, but top-performing ones enjoy sustained growth for years.
With $4.85 billion in revenue over the past 12 months, Domino's is one of the larger restaurant chains in the industry and benefits from a well-known brand that influences consumer purchasing decisions. However, its scale is a double-edged sword because it’s harder to find incremental growth when your existing restaurant banners have penetrated most of the market. For Domino's to boost its sales, it likely needs to adjust its prices, launch new chains, or lean into foreign markets.
As you can see below, Domino’s sales grew at a tepid 5.3% compounded annual growth rate over the last six years (we compare to 2019 to normalize for COVID-19 impacts), but to its credit, it opened new restaurants and increased sales at existing, established dining locations.
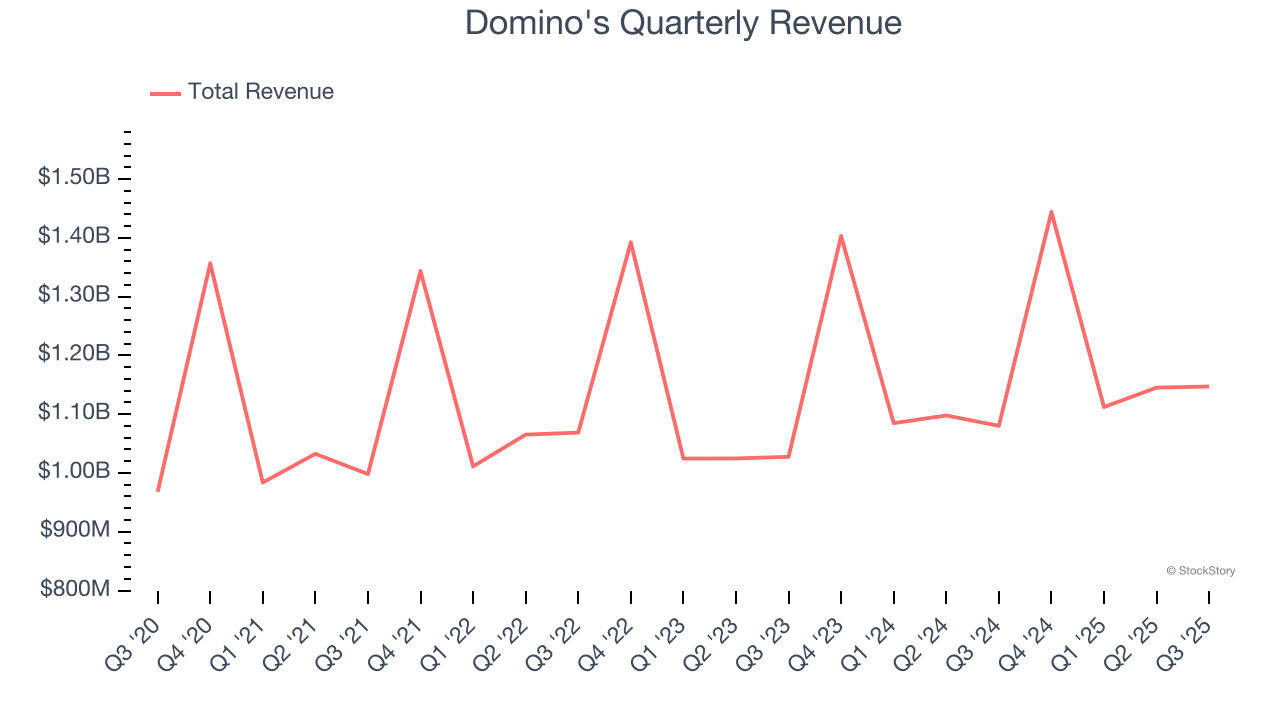
This quarter, Domino's reported year-on-year revenue growth of 6.2%, and its $1.15 billion of revenue exceeded Wall Street’s estimates by 0.9%.
Looking ahead, sell-side analysts expect revenue to grow 5.5% over the next 12 months, similar to its six-year rate. This projection is underwhelming and implies its newer menu offerings will not accelerate its top-line performance yet.
Here at StockStory, we certainly understand the potential of thematic investing. Diverse winners from Microsoft (MSFT) to Alphabet (GOOG), Coca-Cola (KO) to Monster Beverage (MNST) could all have been identified as promising growth stories with a megatrend driving the growth. So, in that spirit, we’ve identified a relatively under-the-radar profitable growth stock benefiting from the rise of AI, available to you FREE via this link.
Restaurant Performance
Number of Restaurants
A restaurant chain’s total number of dining locations influences how much it can sell and how quickly revenue can grow.
Domino's sported 21,750 locations in the latest quarter. Over the last two years, it has opened new restaurants at a rapid clip by averaging 3.5% annual growth, among the fastest in the restaurant sector. Furthermore, one dynamic making expansion more seamless is the company’s franchise model, where franchisees are primarily responsible for opening new restaurants while Domino's provides support.
When a chain opens new restaurants, it usually means it’s investing for growth because there’s healthy demand for its meals and there are markets where its concepts have few or no locations.
Same-Store Sales
A company's restaurant base only paints one part of the picture. When demand is high, it makes sense to open more. But when demand is low, it’s prudent to close some locations and use the money in other ways. Same-store sales gives us insight into this topic because it measures organic growth at restaurants open for at least a year.
Domino’s demand has been healthy for a restaurant chain over the last two years. On average, the company has grown its same-store sales by a robust 2.7% per year. This performance suggests its rollout of new restaurants could be beneficial for shareholders. When a chain has demand, more locations should help it reach more customers and boost revenue growth.
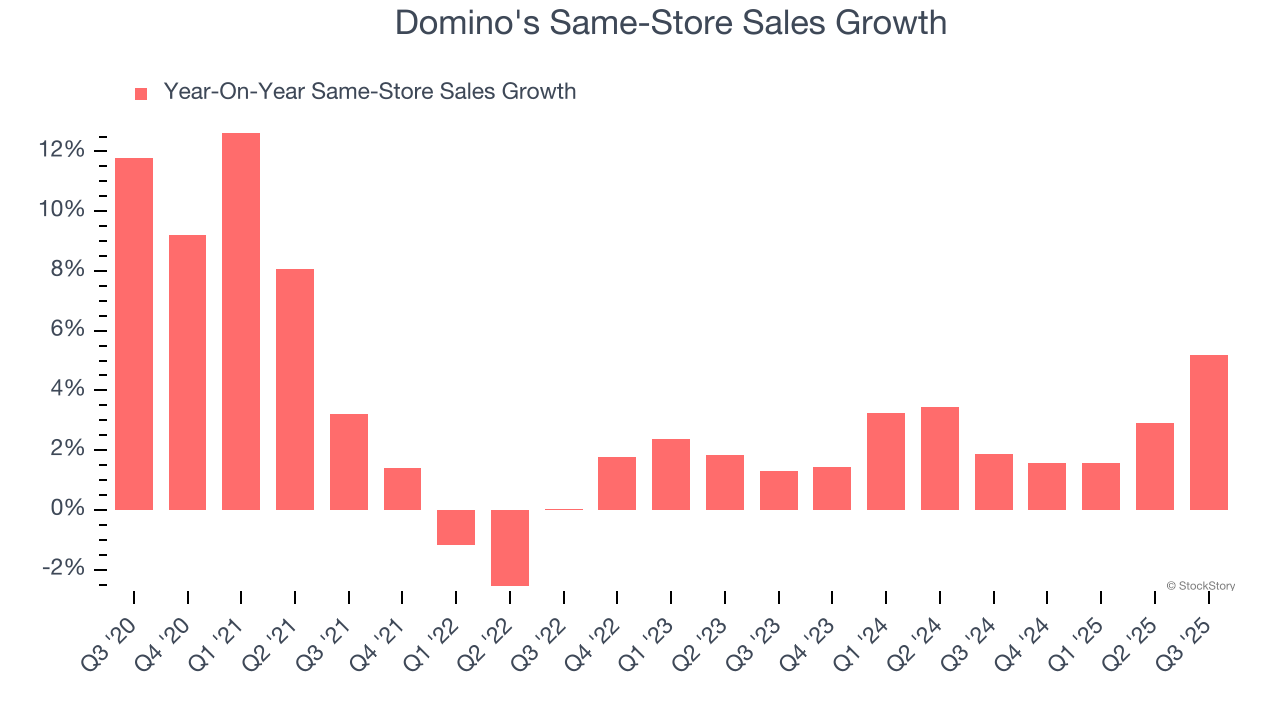
In the latest quarter, Domino’s same-store sales rose 5.2% year on year. This growth was an acceleration from its historical levels, which is always an encouraging sign.
Key Takeaways from Domino’s Q3 Results
We were impressed by how significantly Domino's blew past analysts’ EBITDA expectations this quarter. We were also excited its same-store sales outperformed Wall Street’s estimates by a wide margin. Zooming out, we think this was a solid print. The stock traded up 4.4% to $426.40 immediately after reporting.
Domino's put up rock-solid earnings, but one quarter doesn’t necessarily make the stock a buy. Let’s see if this is a good investment. The latest quarter does matter, but not nearly as much as longer-term fundamentals and valuation, when deciding if the stock is a buy. We cover that in our actionable full research report which you can read here, it’s free for active Edge members.


