ETFOptimize | High-performance ETF-based Investment Strategies

Quantitative strategies, Wall Street-caliber research, and insightful market analysis since 1998.


ETFOptimize | HOME
Close Window

2 Reasons to Avoid CME and 1 Stock to Buy Instead

CME Cover Image

CME Group currently trades at $267.06 per share and has shown little upside over the past six months, posting a middling return of 1.6%. The stock also fell short of the S&P 500’s 23.2% gain during that period.

Is now the time to buy CME Group, or should you be careful about including it in your portfolio? Check out our in-depth research report to see what our analysts have to say, it’s free for active Edge members.

Why Is CME Group Not Exciting?

We're cautious about CME Group. Here are two reasons there are better opportunities than CME and a stock we'd rather own.

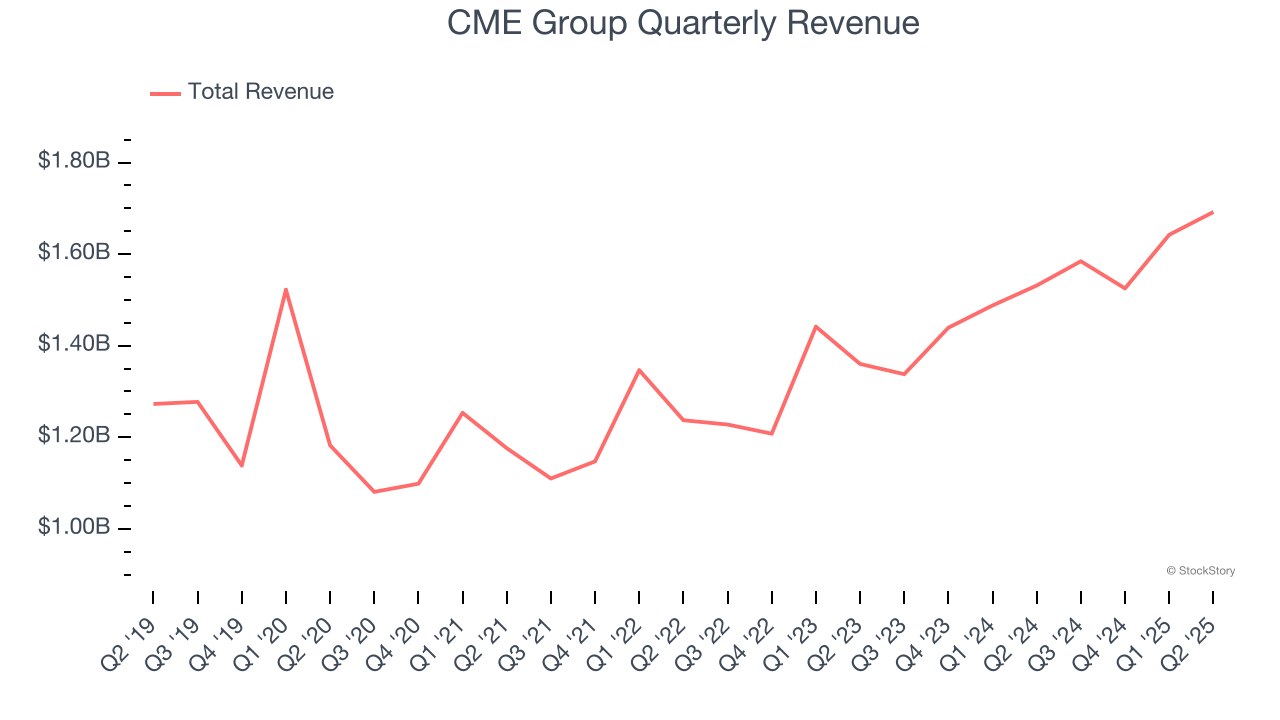
1. Long-Term Revenue Growth Disappoints

A company’s long-term sales performance is one signal of its overall quality. Any business can have short-term success, but a top-tier one grows for years.

Regrettably, CME Group’s revenue grew at a tepid 4.7% compounded annual growth rate over the last five years. This was below our standard for the financials sector.

CME Group Quarterly Revenue

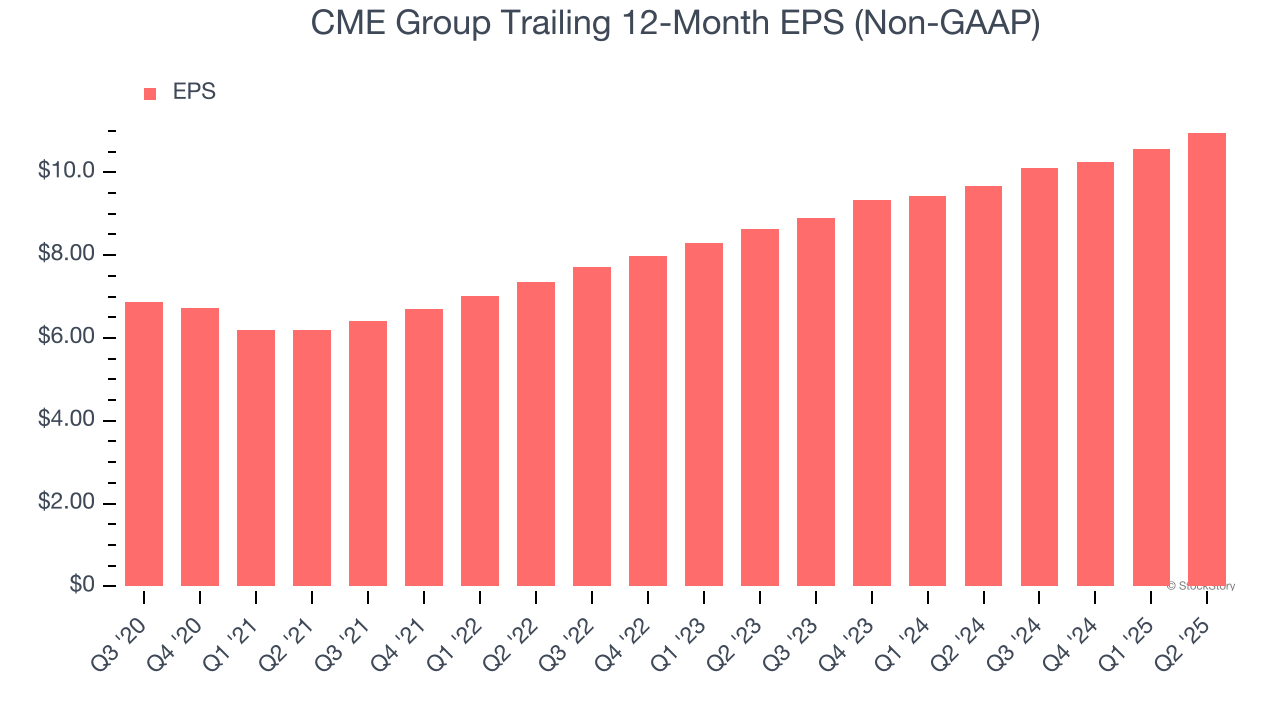
2. EPS Barely Growing

We track the long-term change in earnings per share (EPS) because it highlights whether a company’s growth is profitable.

CME Group’s EPS grew at an unimpressive 8.6% compounded annual growth rate over the last five years. On the bright side, this performance was better than its 4.7% annualized revenue growth and tells us the company became more profitable on a per-share basis as it expanded.

CME Group Trailing 12-Month EPS (Non-GAAP)

Final Judgment

CME Group isn’t a terrible business, but it doesn’t pass our quality test. With its shares lagging the market recently, the stock trades at 24× forward P/E (or $267.06 per share). This multiple tells us a lot of good news is priced in - we think there are better opportunities elsewhere. We’d recommend looking at a top digital advertising platform riding the creator economy.

High-Quality Stocks for All Market Conditions

When Trump unveiled his aggressive tariff plan in April 2025, markets tanked as investors feared a full-blown trade war. But those who panicked and sold missed the subsequent rebound that’s already erased most losses.

Don’t let fear keep you from great opportunities and take a look at Top 5 Strong Momentum Stocks for this week. This is a curated list of our High Quality stocks that have generated a market-beating return of 183% over the last five years (as of March 31st 2025).

Stocks that made our list in 2020 include now familiar names such as Nvidia (+1,545% between March 2020 and March 2025) as well as under-the-radar businesses like the once-micro-cap company Kadant (+351% five-year return). Find your next big winner with StockStory today.

StockStory is growing and hiring equity analyst and marketing roles. Are you a 0 to 1 builder passionate about the markets and AI? See the open roles here.

Recent Quotes

View More
Symbol Price Change (%)
AMZN  244.22
+0.00 (0.00%)
AAPL  270.37
+0.00 (0.00%)
AMD  256.12
+0.00 (0.00%)
BAC  53.45
+0.00 (0.00%)
GOOG  281.82
+0.00 (0.00%)
META  648.35
+0.00 (0.00%)
MSFT  517.81
+0.00 (0.00%)
NVDA  202.49
+0.00 (0.00%)
ORCL  262.61
+0.00 (0.00%)
TSLA  456.56
+0.00 (0.00%)
Stock Quote API & Stock News API supplied by www.cloudquote.io
Quotes delayed at least 20 minutes.
By accessing this page, you agree to the Privacy Policy and Terms Of Service.


IntelligentValue Home
Close Window

DISCLAIMER

All content herein is issued solely for informational purposes and is not to be construed as an offer to sell or the solicitation of an offer to buy, nor should it be interpreted as a recommendation to buy, hold or sell (short or otherwise) any security.  All opinions, analyses, and information included herein are based on sources believed to be reliable, but no representation or warranty of any kind, expressed or implied, is made including but not limited to any representation or warranty concerning accuracy, completeness, correctness, timeliness or appropriateness. We undertake no obligation to update such opinions, analysis or information. You should independently verify all information contained on this website. Some information is based on analysis of past performance or hypothetical performance results, which have inherent limitations. We make no representation that any particular equity or strategy will or is likely to achieve profits or losses similar to those shown. Shareholders, employees, writers, contractors, and affiliates associated with ETFOptimize.com may have ownership positions in the securities that are mentioned. If you are not sure if ETFs, algorithmic investing, or a particular investment is right for you, you are urged to consult with a Registered Investment Advisor (RIA). Neither this website nor anyone associated with producing its content are Registered Investment Advisors, and no attempt is made herein to substitute for personalized, professional investment advice. Neither ETFOptimize.com, Global Alpha Investments, Inc., nor its employees, service providers, associates, or affiliates are responsible for any investment losses you may incur as a result of using the information provided herein. Remember that past investment returns may not be indicative of future returns.

Copyright © 1998-2017 ETFOptimize.com, a publication of Optimized Investments, Inc. All rights reserved.