What a brutal six months it’s been for CAVA. The stock has dropped 26.9% and now trades at $64.59, rattling many shareholders. This was partly driven by its softer quarterly results and may have investors wondering how to approach the situation.
Given the weaker price action, is this a buying opportunity for CAVA? Find out in our full research report, it’s free for active Edge members.
Why Does CAVA Spark Debate?
Starting from a single Washington, D.C. location, CAVA (NYSE: CAVA) operates a fast-casual restaurant chain offering customizable Mediterranean-inspired dishes.
Two Positive Attributes:
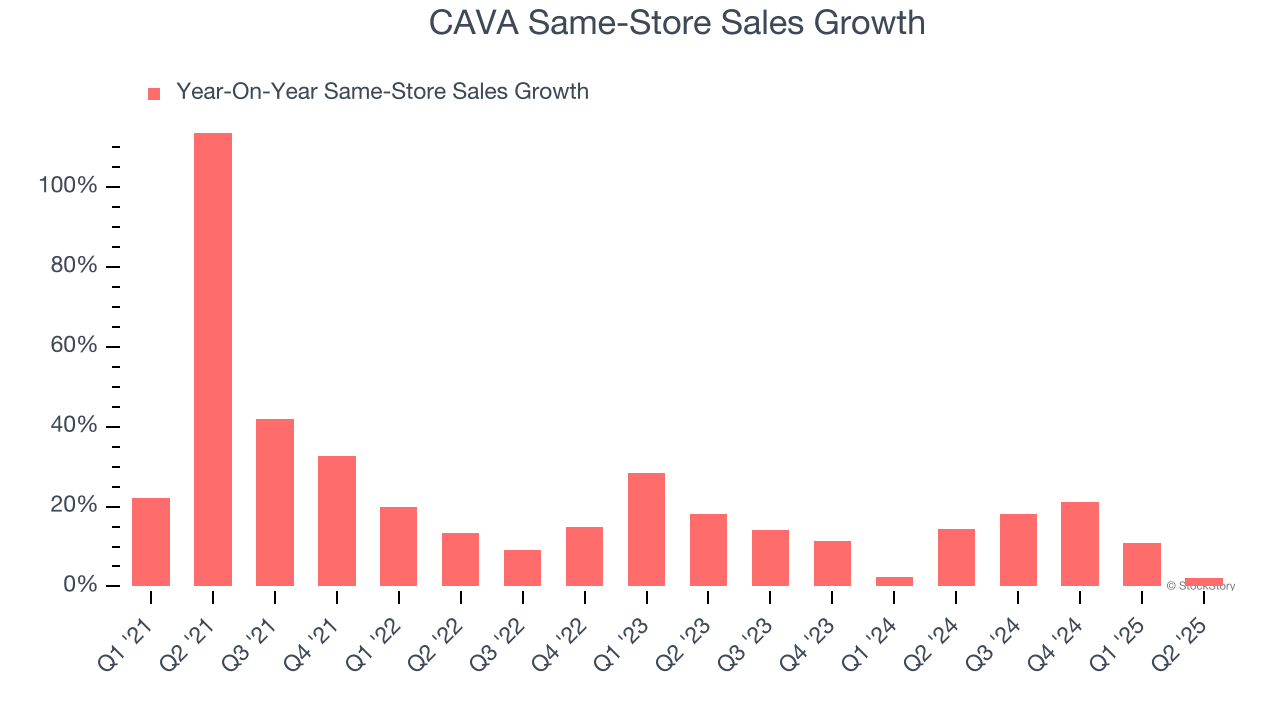
1. Surging Same-Store Sales Show Increasing Demand
Same-store sales is an industry measure of whether revenue is growing at existing restaurants, and it is driven by customer visits (often called traffic) and the average spending per customer (ticket).
CAVA has been one of the most successful restaurant chains over the last two years thanks to skyrocketing demand within its existing dining locations. On average, the company has posted exceptional year-on-year same-store sales growth of 11.8%.
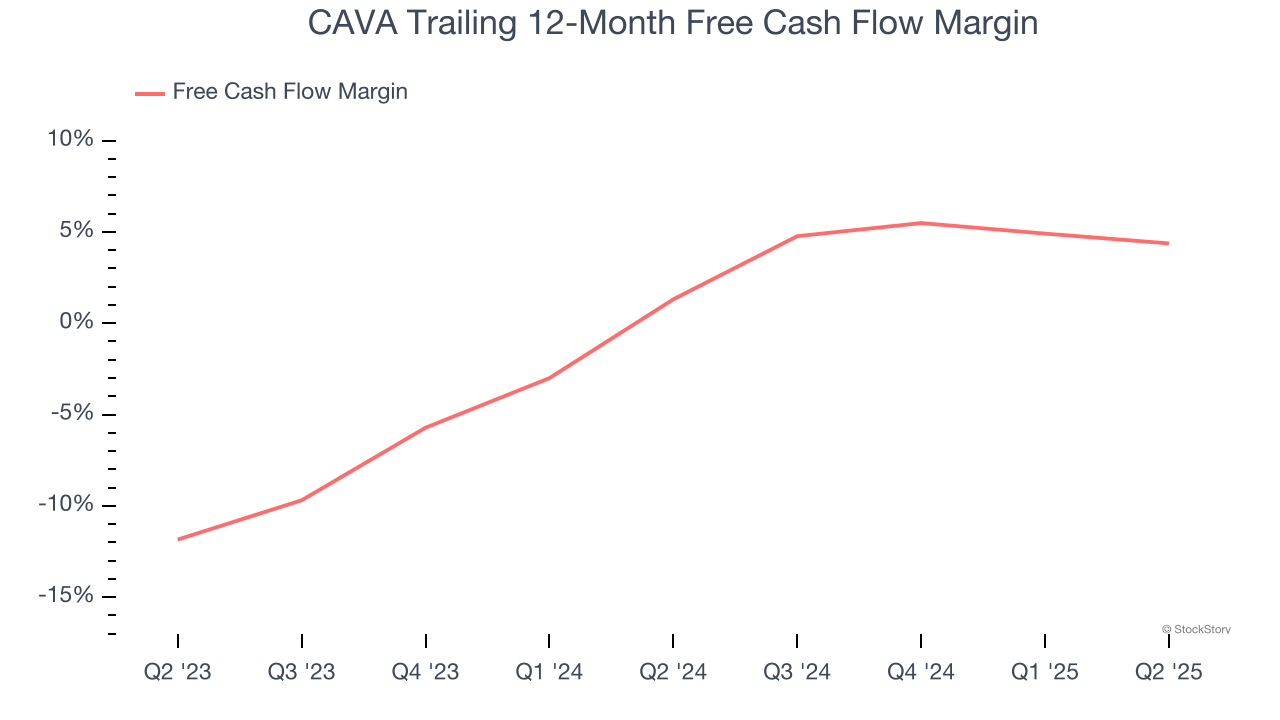
2. Increasing Free Cash Flow Margin Juices Financials
Free cash flow isn't a prominently featured metric in company financials and earnings releases, but we think it's telling because it accounts for all operating and capital expenses, making it tough to manipulate. Cash is king.
As you can see below, CAVA’s margin expanded by 3.1 percentage points over the last year. This is encouraging, and we can see it became a less capital-intensive business because its free cash flow profitability rose more than its operating profitability. CAVA’s free cash flow margin for the trailing 12 months was 4.4%.
One Reason to be Careful:
Previous Growth Initiatives Have Lost Money
Growth gives us insight into a company’s long-term potential, but how capital-efficient was that growth? A company’s ROIC explains this by showing how much operating profit it makes compared to the money it has raised (debt and equity).
Although CAVA has shown solid business quality lately, it struggled to grow profitably in the past. Its five-year average ROIC was negative 8.7%, meaning management lost money while trying to expand the business.
Final Judgment
CAVA’s merits more than compensate for its flaws. With the recent decline, the stock trades at 108.5× forward P/E (or $64.59 per share). Is now the right time to buy? See for yourself in our comprehensive research report, it’s free for active Edge members .
Stocks We Like Even More Than CAVA
Donald Trump’s April 2025 "Liberation Day" tariffs sent markets into a tailspin, but stocks have since rebounded strongly, proving that knee-jerk reactions often create the best buying opportunities.
The smart money is already positioning for the next leg up. Don’t miss out on the recovery - check out our Top 9 Market-Beating Stocks. This is a curated list of our High Quality stocks that have generated a market-beating return of 183% over the last five years (as of March 31st 2025).
Stocks that made our list in 2020 include now familiar names such as Nvidia (+1,545% between March 2020 and March 2025) as well as under-the-radar businesses like the once-small-cap company Comfort Systems (+782% five-year return). Find your next big winner with StockStory today.
StockStory is growing and hiring equity analyst and marketing roles. Are you a 0 to 1 builder passionate about the markets and AI? See the open roles here.