
Over the past six months, TreeHouse Foods’s shares (currently trading at $19.35) have posted a disappointing 13.3% loss, well below the S&P 500’s 23.2% gain. This may have investors wondering how to approach the situation.
Is there a buying opportunity in TreeHouse Foods, or does it present a risk to your portfolio? Dive into our full research report to see our analyst team’s opinion, it’s free for active Edge members.
Why Do We Think TreeHouse Foods Will Underperform?
Even with the cheaper entry price, we're sitting this one out for now. Here are three reasons you should be careful with THS and a stock we'd rather own.
1. Demand Slipping as Sales Volumes Decline
Revenue growth can be broken down into changes in price and volume (the number of units sold). While both are important, volume is the lifeblood of a successful staples business as there’s a ceiling to what consumers will pay for everyday goods; they can always trade down to non-branded products if the branded versions are too expensive.
TreeHouse Foods’s average quarterly sales volumes have shrunk by 2.1% over the last two years. This decrease isn’t ideal because the quantity demanded for consumer staples products is typically stable. 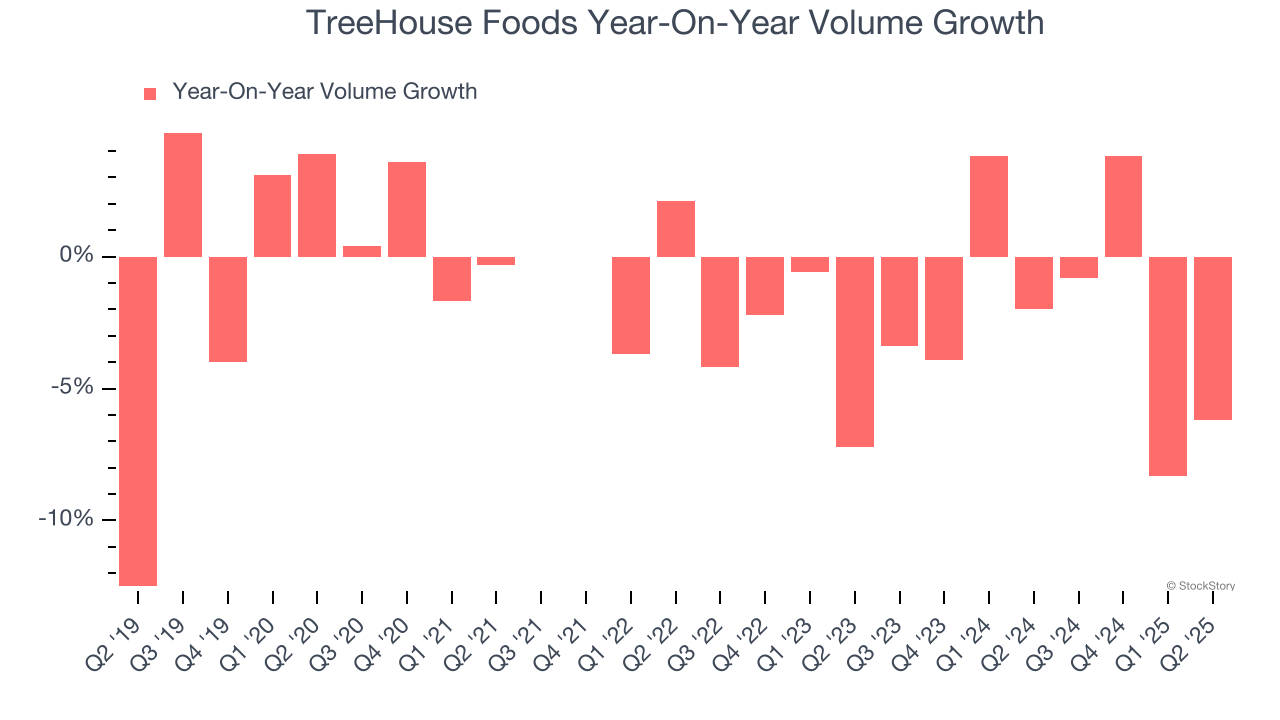
2. Low Gross Margin Reveals Weak Structural Profitability
All else equal, we prefer higher gross margins because they make it easier to generate more operating profits and indicate that a company commands pricing power by offering more differentiated products.
TreeHouse Foods has bad unit economics for a consumer staples company, signaling it operates in a competitive market and lacks pricing power because its products can be substituted. As you can see below, it averaged a 16.5% gross margin over the last two years. Said differently, for every $100 in revenue, a chunky $83.51 went towards paying for raw materials, production of goods, transportation, and distribution. 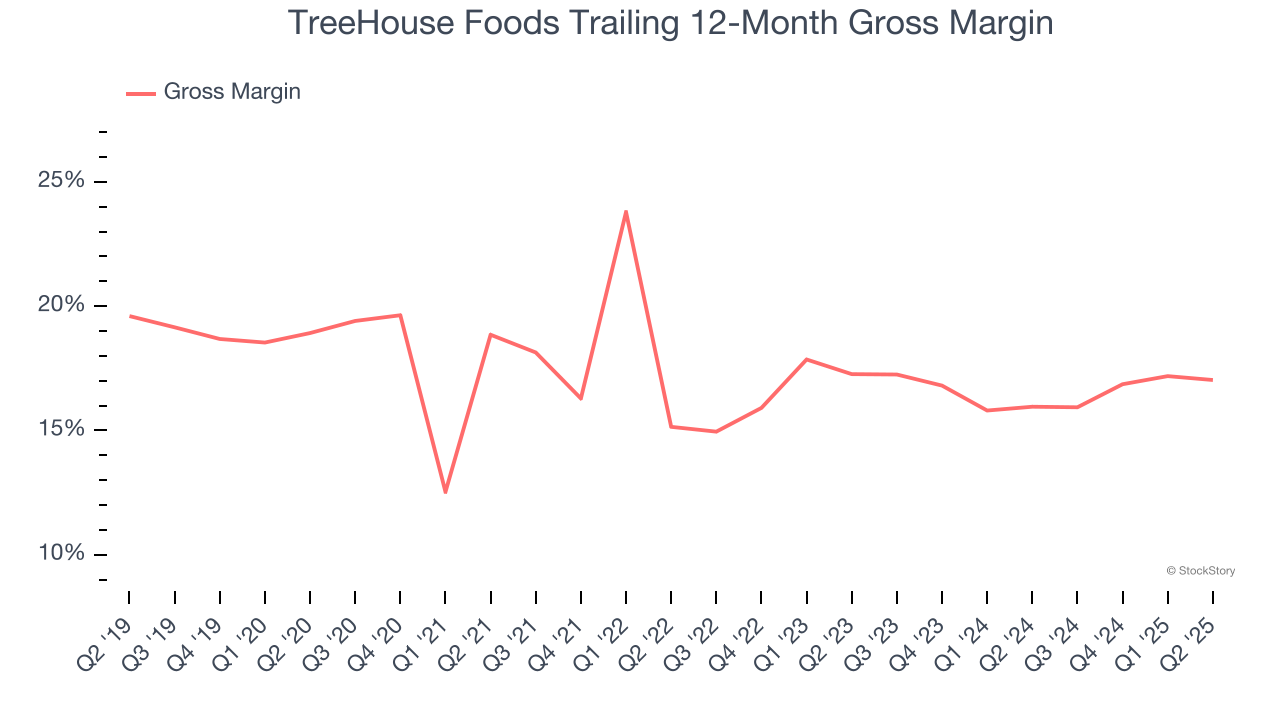
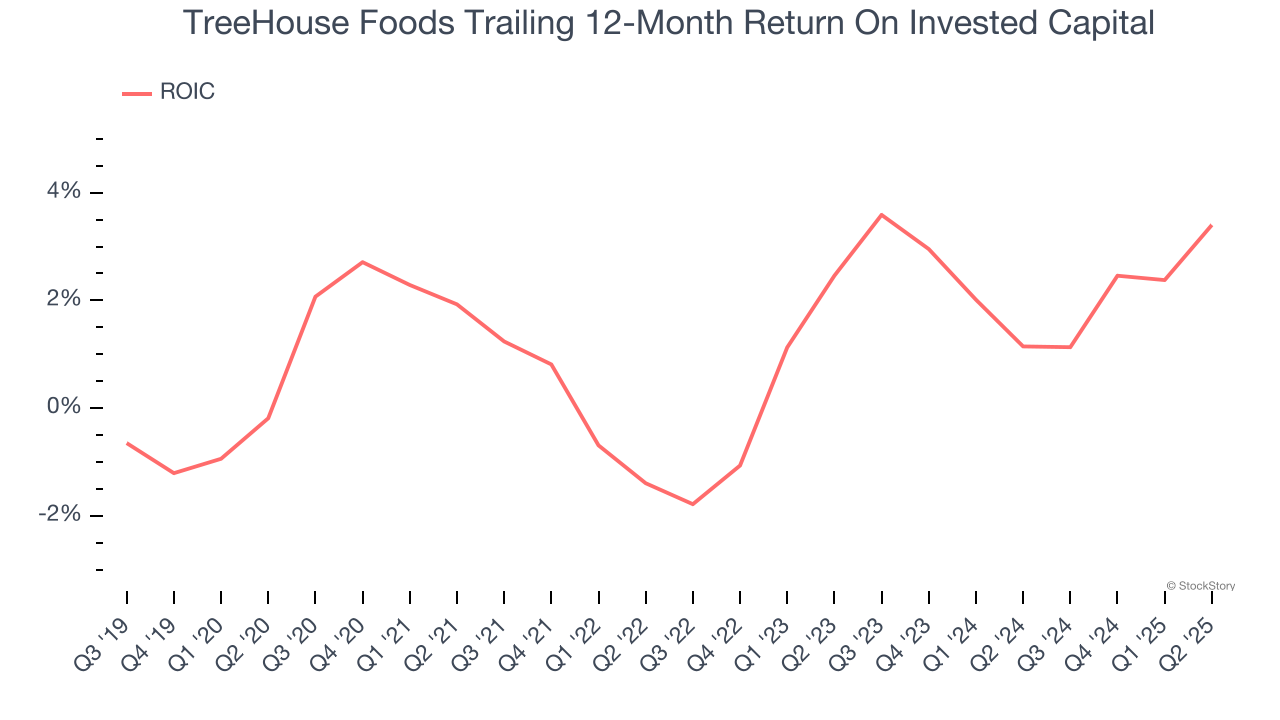
3. Previous Growth Initiatives Haven’t Impressed
Growth gives us insight into a company’s long-term potential, but how capital-efficient was that growth? A company’s ROIC explains this by showing how much operating profit it makes compared to the money it has raised (debt and equity).
TreeHouse Foods historically did a mediocre job investing in profitable growth initiatives. Its five-year average ROIC was 1.5%, lower than the typical cost of capital (how much it costs to raise money) for consumer staples companies.
Final Judgment
TreeHouse Foods doesn’t pass our quality test. Following the recent decline, the stock trades at 10.3× forward P/E (or $19.35 per share). While this valuation is reasonable, we don’t see a big opportunity at the moment. There are better stocks to buy right now. We’d suggest looking at a safe-and-steady industrials business benefiting from an upgrade cycle.
High-Quality Stocks for All Market Conditions
Trump’s April 2025 tariff bombshell triggered a massive market selloff, but stocks have since staged an impressive recovery, leaving those who panic sold on the sidelines.
Take advantage of the rebound by checking out our Top 6 Stocks for this week. This is a curated list of our High Quality stocks that have generated a market-beating return of 183% over the last five years (as of March 31st 2025).
Stocks that made our list in 2020 include now familiar names such as Nvidia (+1,545% between March 2020 and March 2025) as well as under-the-radar businesses like the once-micro-cap company Tecnoglass (+1,754% five-year return). Find your next big winner with StockStory today.
StockStory is growing and hiring equity analyst and marketing roles. Are you a 0 to 1 builder passionate about the markets and AI? See the open roles here.


