
Regional banking company Synovus Financial (NYSE: SNV) reported Q3 CY2025 results topping the market’s revenue expectations, with sales up 9% year on year to $615.4 million. Its non-GAAP profit of $1.46 per share was 7.8% above analysts’ consensus estimates.
Is now the time to buy Synovus Financial? Find out by accessing our full research report, it’s free for active Edge members.
Synovus Financial (SNV) Q3 CY2025 Highlights:
- Net Interest Income: $474.7 million vs analyst estimates of $474.7 million (7.7% year-on-year growth, in line)
- Net Interest Margin: 3.4% vs analyst estimates of 3.4% (2.8 basis point beat)
- Revenue: $615.4 million vs analyst estimates of $603.1 million (9% year-on-year growth, 2% beat)
- Efficiency Ratio: 56.5% vs analyst estimates of 53.1% (337.8 basis point miss)
- Adjusted EPS: $1.46 vs analyst estimates of $1.35 (7.8% beat)
- Tangible Book Value per Share: $34.40 vs analyst estimates of $34.05 (13.6% year-on-year growth, 1% beat)
- Market Capitalization: $6.64 billion
"Synovus delivered solid third-quarter results, driven by continued net interest margin expansion, strong non-interest revenue growth and favorable credit trends,” said Synovus Chairman, CEO and President Kevin Blair.
Company Overview
Tracing its roots back to 1888 when a worker accidentally dropped a textile mill payroll into the dust, prompting the need for better banking, Synovus Financial (NYSE: SNV) is a regional financial services company that provides commercial and consumer banking, wealth management, and specialized lending services across five southeastern states.
Sales Growth
In general, banks make money from two primary sources. The first is net interest income, which is interest earned on loans, mortgages, and investments in securities minus interest paid out on deposits. The second source is non-interest income, which can come from bank account, credit card, wealth management, investing banking, and trading fees. Unfortunately, Synovus Financial’s 3.2% annualized revenue growth over the last five years was mediocre. This fell short of our benchmark for the banking sector and is a tough starting point for our analysis.
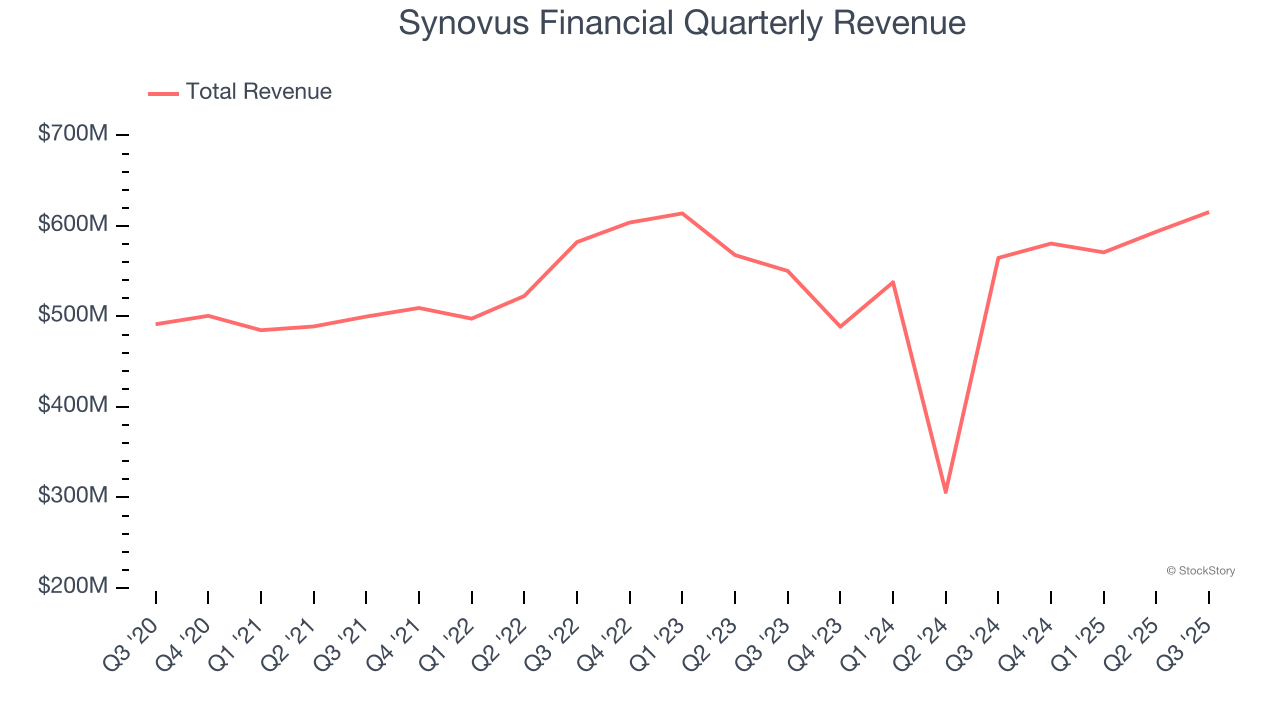
We at StockStory place the most emphasis on long-term growth, but within financials, a half-decade historical view may miss recent interest rate changes, market returns, and industry trends. Synovus Financial’s recent performance shows its demand has slowed as its revenue was flat over the last two years. 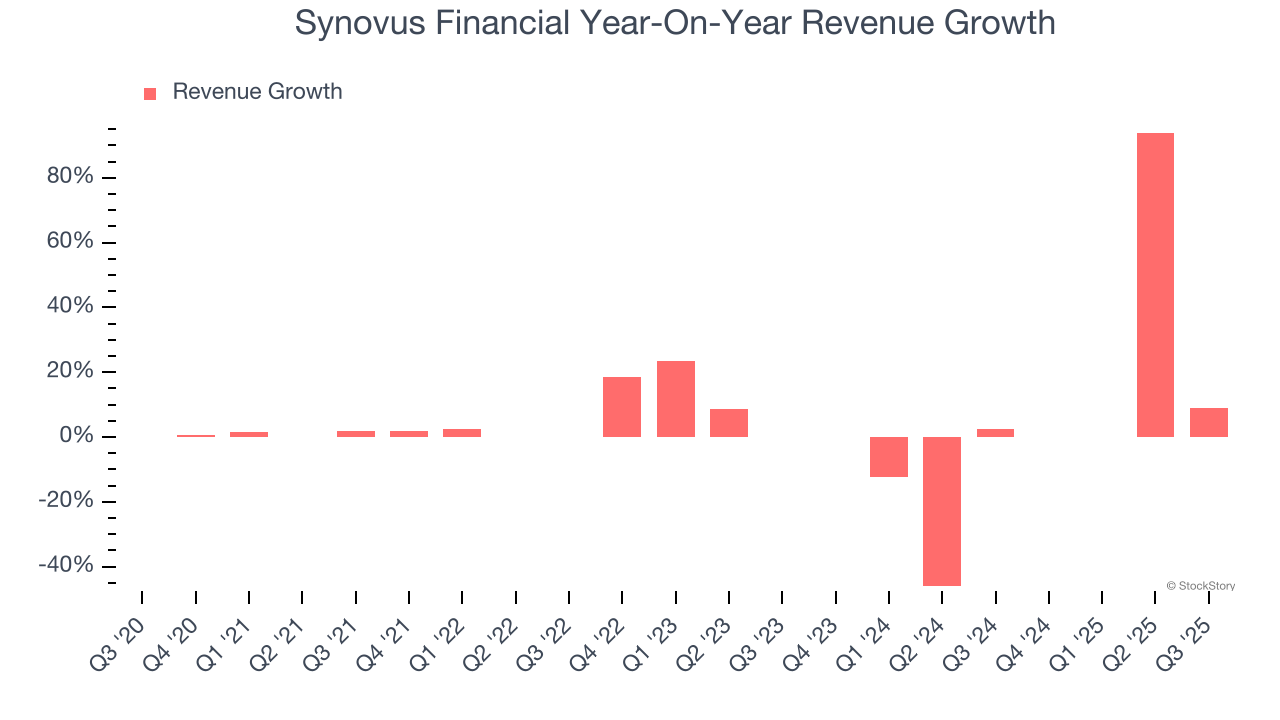 Note: Quarters not shown were determined to be outliers, impacted by outsized investment gains/losses that are not indicative of the recurring fundamentals of the business.
This quarter, Synovus Financial reported year-on-year revenue growth of 9%, and its $615.4 million of revenue exceeded Wall Street’s estimates by 2%.
Net interest income made up 82.5% of the company’s total revenue during the last five years, meaning Synovus Financial barely relies on non-interest income to drive its overall growth.
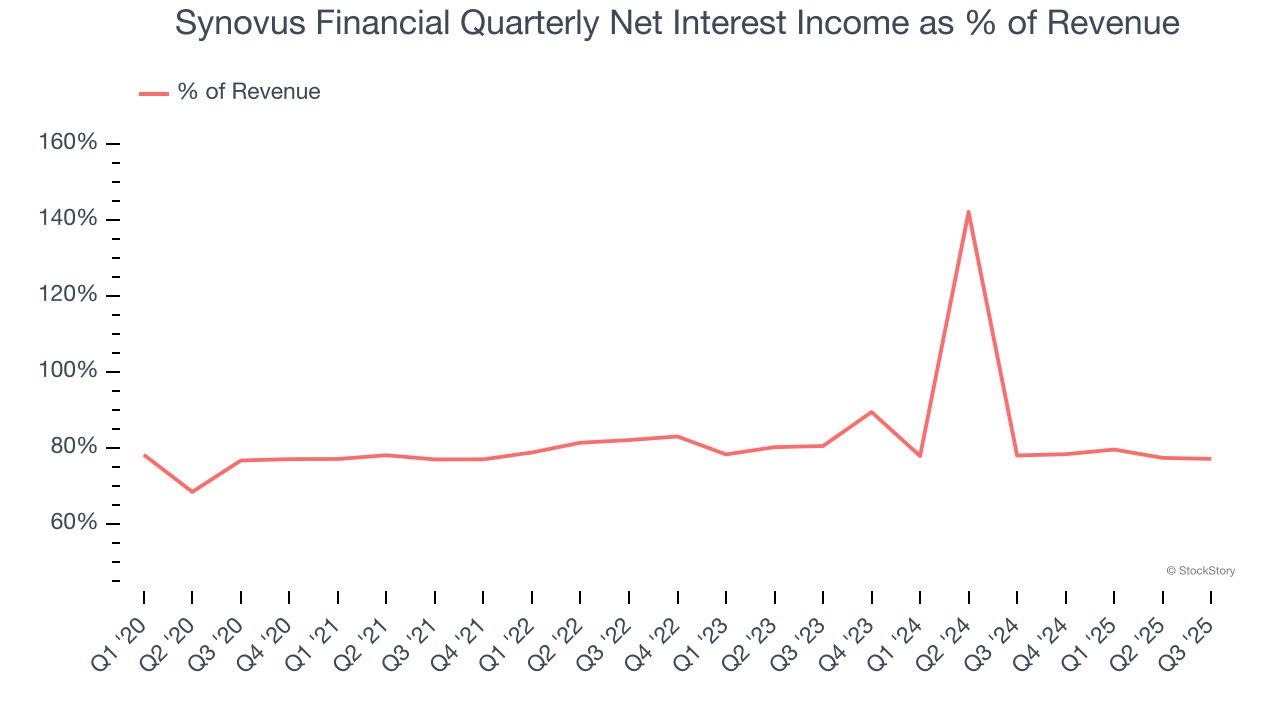
While banks generate revenue from multiple sources, investors view net interest income as the cornerstone - its predictable, recurring characteristics stand in sharp contrast to the volatility of non-interest income.
Here at StockStory, we certainly understand the potential of thematic investing. Diverse winners from Microsoft (MSFT) to Alphabet (GOOG), Coca-Cola (KO) to Monster Beverage (MNST) could all have been identified as promising growth stories with a megatrend driving the growth. So, in that spirit, we’ve identified a relatively under-the-radar profitable growth stock benefiting from the rise of AI, available to you FREE via this link.
Tangible Book Value Per Share (TBVPS)
Banks profit by intermediating between depositors and borrowers, making them fundamentally balance sheet-driven enterprises. Market participants emphasize balance sheet quality and sustained book value growth when evaluating these institutions.
This is why we consider tangible book value per share (TBVPS) the most important metric to track for banks. TBVPS represents the real, liquid net worth per share of a bank, excluding intangible assets that have debatable value upon liquidation. Other (and more commonly known) per-share metrics like EPS can sometimes be murky due to M&A or accounting rules allowing for loan losses to be spread out.
Synovus Financial’s TBVPS grew at a mediocre 4.7% annual clip over the last five years. However, TBVPS growth has accelerated recently, growing by 20.4% annually over the last two years from $23.74 to $34.40 per share.
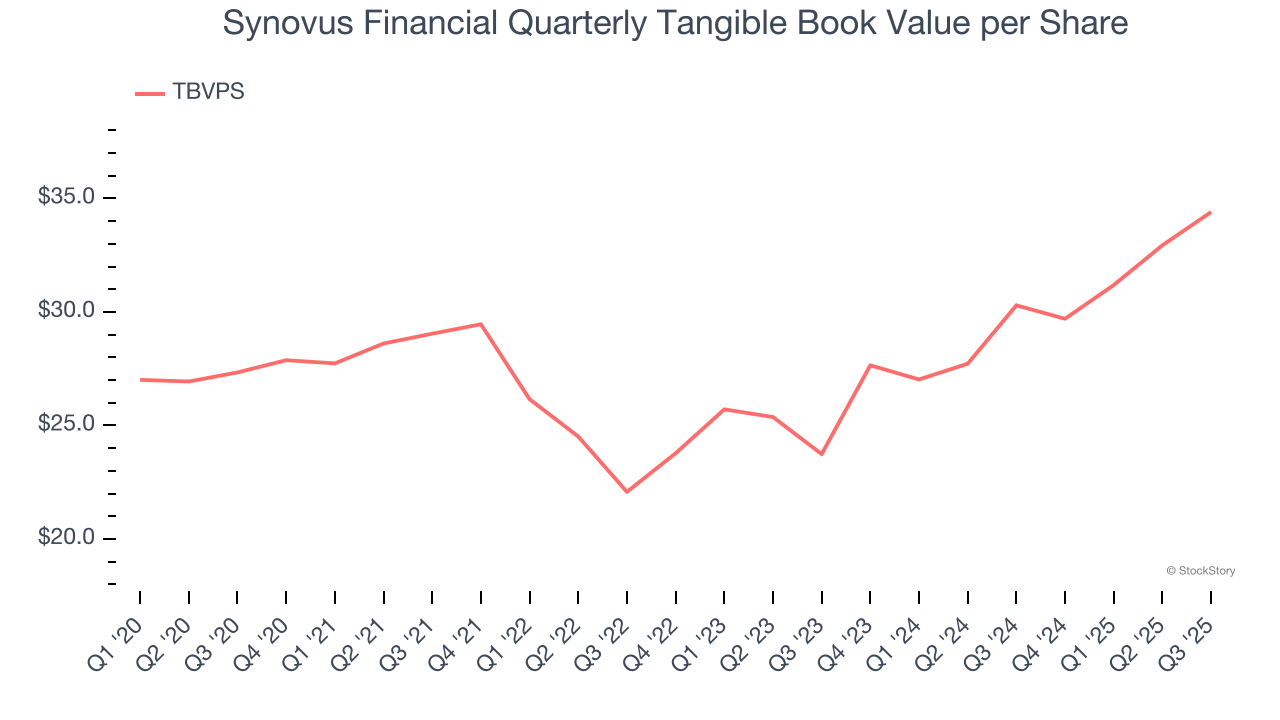
Over the next 12 months, Consensus estimates call for Synovus Financial’s TBVPS to grow by 10.7% to $38.09, solid growth rate.
Key Takeaways from Synovus Financial’s Q3 Results
It was encouraging to see Synovus Financial beat analysts’ revenue expectations this quarter. We were also happy its tangible book value per share narrowly outperformed Wall Street’s estimates. Overall, this print had some key positives. The stock remained flat at $47.01 immediately following the results.
Synovus Financial put up rock-solid earnings, but one quarter doesn’t necessarily make the stock a buy. Let’s see if this is a good investment. When making that decision, it’s important to consider its valuation, business qualities, as well as what has happened in the latest quarter. We cover that in our actionable full research report which you can read here, it’s free for active Edge members.


