While the S&P 500 is up 26.5% since April 2025, Energy Recovery (currently trading at $16.27 per share) has lagged behind, posting a return of 9.4%. This may have investors wondering how to approach the situation.
Given the relatively weaker price action, is now a good time to buy ERII? Or are investors better off allocating their money elsewhere?
Why Does ERII Stock Spark Debate?
Having saved far more than a trillion gallons of water, Energy Recovery (NASDAQ: ERII) provides energy recovery devices to the water treatment, oil and gas, and chemical processing sectors.
Two Positive Attributes:
1. Skyrocketing Revenue Shows Strong Momentum
We at StockStory place the most emphasis on long-term growth, but within industrials, a stretched historical view may miss cycles, industry trends, or a company capitalizing on catalysts such as a new contract win or a successful product line. Energy Recovery’s annualized revenue growth of 15.2% over the last two years is above its five-year trend, suggesting its demand recently accelerated. 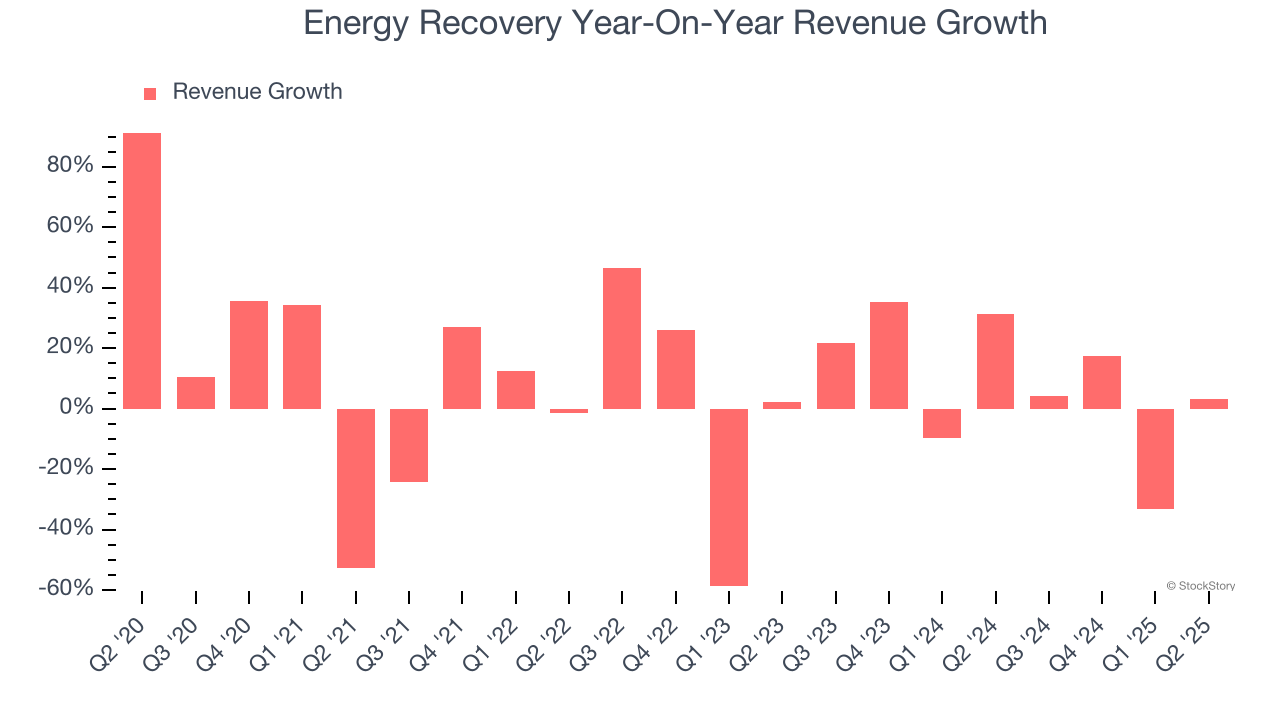
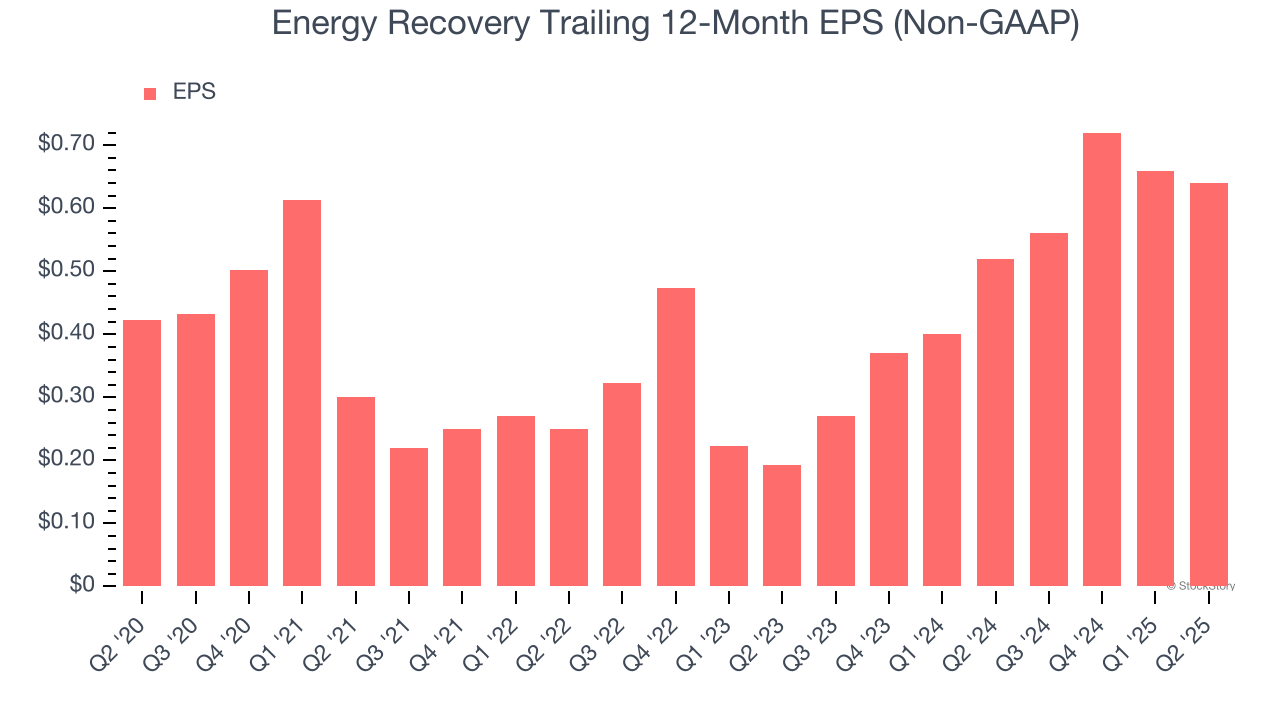
2. EPS Moving Up Steadily
We track the long-term change in earnings per share (EPS) because it highlights whether a company’s growth is profitable.
Energy Recovery’s EPS grew at a decent 8.6% compounded annual growth rate over the last five years, higher than its 5.3% annualized revenue growth. This tells us the company became more profitable on a per-share basis as it expanded.
One Reason to be Careful:
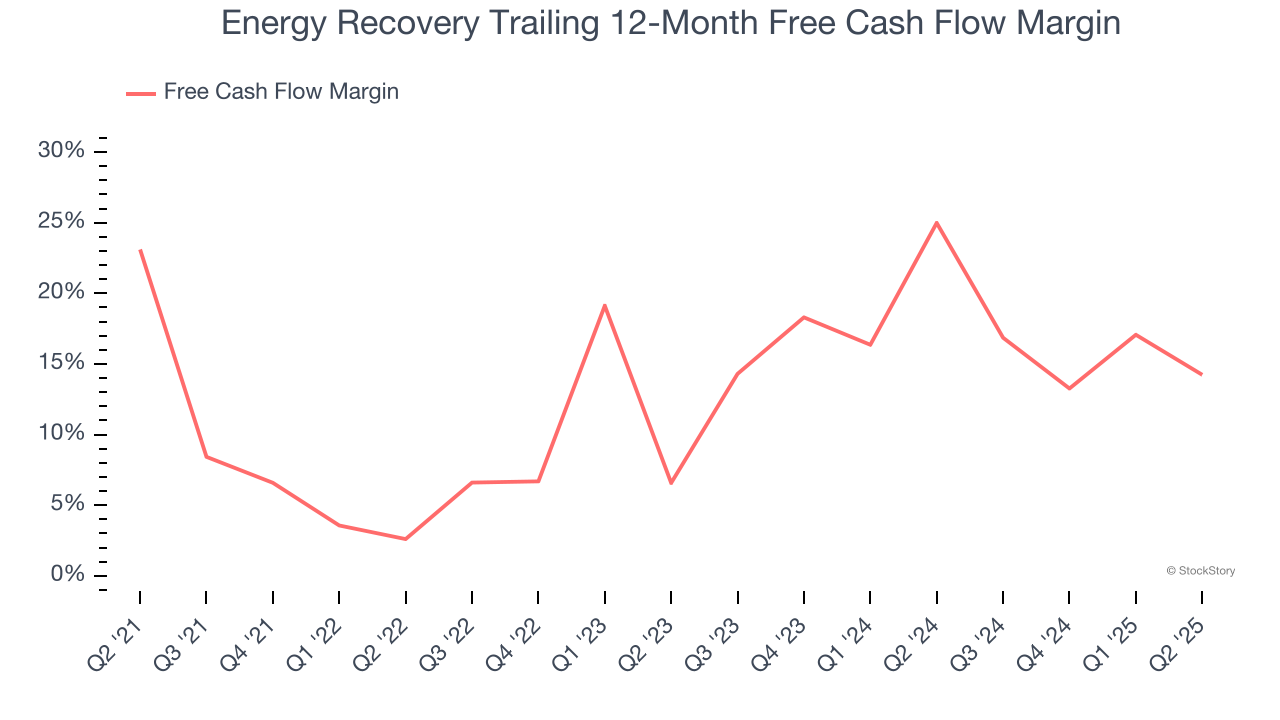
Free Cash Flow Margin Dropping
Free cash flow isn't a prominently featured metric in company financials and earnings releases, but we think it's telling because it accounts for all operating and capital expenses, making it tough to manipulate. Cash is king.
As you can see below, Energy Recovery’s margin dropped by 8.9 percentage points over the last five years. If its declines continue, it could signal increasing investment needs and capital intensity. Energy Recovery’s free cash flow margin for the trailing 12 months was 14.2%.
Final Judgment
Energy Recovery’s merits more than compensate for its flaws. With its shares trailing the market in recent months, the stock trades at 21.2× forward P/E (or $16.27 per share). Is now the time to initiate a position? See for yourself in our comprehensive research report, it’s free for active Edge members .
Stocks We Like Even More Than Energy Recovery
Donald Trump’s April 2025 "Liberation Day" tariffs sent markets into a tailspin, but stocks have since rebounded strongly, proving that knee-jerk reactions often create the best buying opportunities.
The smart money is already positioning for the next leg up. Don’t miss out on the recovery - check out our Top 6 Stocks for this week. This is a curated list of our High Quality stocks that have generated a market-beating return of 183% over the last five years (as of March 31st 2025).
Stocks that made our list in 2020 include now familiar names such as Nvidia (+1,545% between March 2020 and March 2025) as well as under-the-radar businesses like the once-micro-cap company Kadant (+351% five-year return). Find your next big winner with StockStory today.
StockStory is growing and hiring equity analyst and marketing roles. Are you a 0 to 1 builder passionate about the markets and AI? See the open roles here.