
Teladoc trades at $8.94 per share and has stayed right on track with the overall market, gaining 29.6% over the last six months. At the same time, the S&P 500 has returned 26.5%.
Is there a buying opportunity in Teladoc, or does it present a risk to your portfolio? Get the full breakdown from our expert analysts, it’s free for active Edge members.
Why Is Teladoc Not Exciting?
We're cautious about Teladoc. Here are three reasons you should be careful with TDOC and a stock we'd rather own.
1. Long-Term Revenue Growth Disappoints
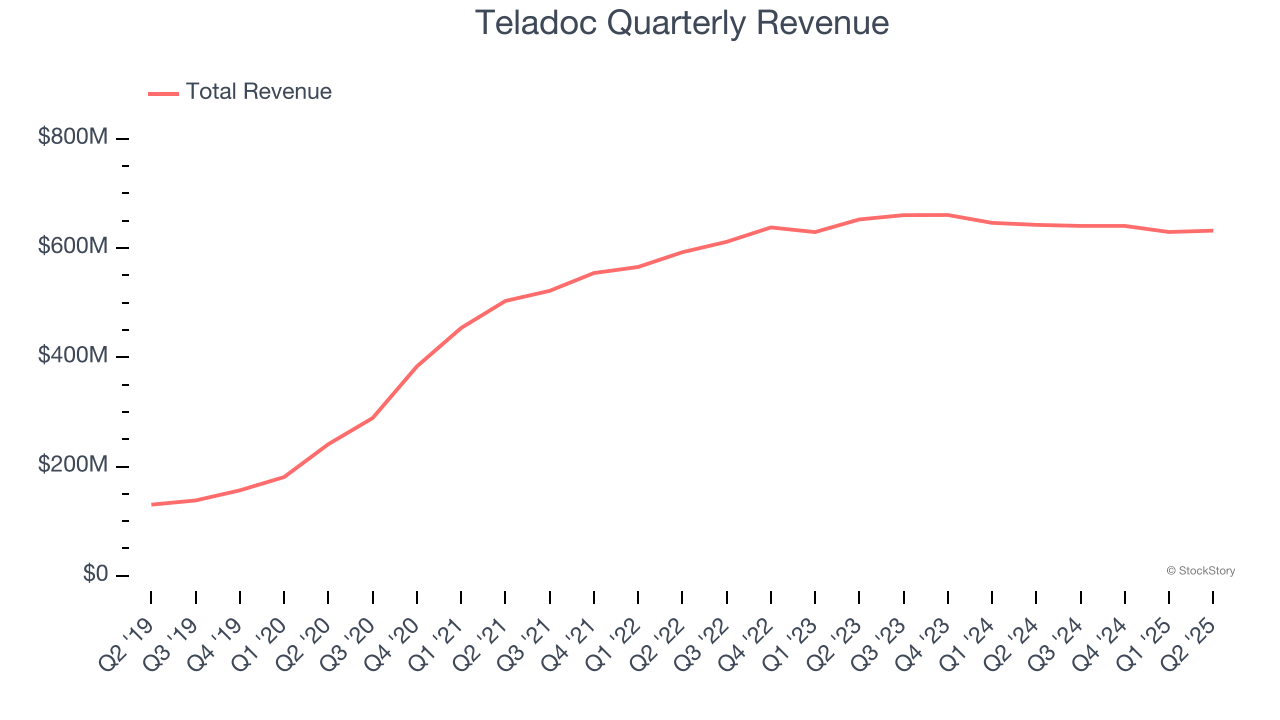
A company’s long-term performance is an indicator of its overall quality. Any business can put up a good quarter or two, but many enduring ones grow for years. Over the last three years, Teladoc grew its sales at a sluggish 4.4% compounded annual growth rate. This fell short of our benchmark for the consumer internet sector.
2. Customer Spending Decreases, Engagement Falling?
Average revenue per user (ARPU) is a critical metric to track because it measures how much the company earns in transaction fees from each user. ARPU also gives us unique insights into a user’s average order size and Teladoc’s take rate, or "cut", on each order.
Teladoc’s ARPU fell over the last two years, averaging 7.1% annual declines. This isn’t great, but the increase in u.s. integrated care members is more relevant for assessing long-term business potential. We’ll monitor the situation closely; if Teladoc tries boosting ARPU by taking a more aggressive approach to monetization, it’s unclear whether users can continue growing at the current pace. 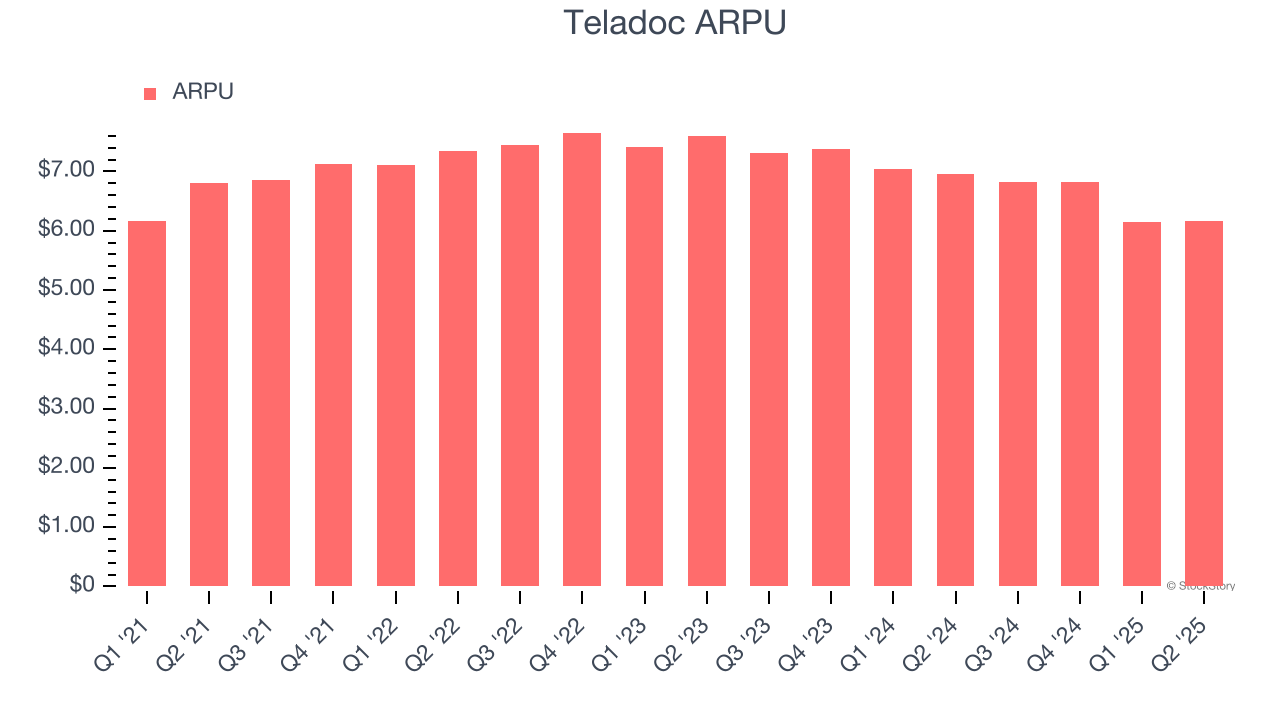
3. Projected Revenue Growth Shows Limited Upside
Forecasted revenues by Wall Street analysts signal a company’s potential. Predictions may not always be accurate, but accelerating growth typically boosts valuation multiples and stock prices while slowing growth does the opposite.
Over the next 12 months, sell-side analysts expect Teladoc’s revenue to stall, a deceleration versus This projection doesn't excite us and suggests its products and services will face some demand challenges.
Final Judgment
Teladoc isn’t a terrible business, but it doesn’t pass our quality test. That said, the stock currently trades at 5.6× forward EV/EBITDA (or $8.94 per share). This valuation multiple is fair, but we don’t have much faith in the company. We're fairly confident there are better investments elsewhere. We’d suggest looking at our favorite semiconductor picks and shovels play.
Stocks We Would Buy Instead of Teladoc
When Trump unveiled his aggressive tariff plan in April 2025, markets tanked as investors feared a full-blown trade war. But those who panicked and sold missed the subsequent rebound that’s already erased most losses.
Don’t let fear keep you from great opportunities and take a look at Top 9 Market-Beating Stocks. This is a curated list of our High Quality stocks that have generated a market-beating return of 183% over the last five years (as of March 31st 2025).
Stocks that made our list in 2020 include now familiar names such as Nvidia (+1,545% between March 2020 and March 2025) as well as under-the-radar businesses like the once-micro-cap company Kadant (+351% five-year return). Find your next big winner with StockStory today.
StockStory is growing and hiring equity analyst and marketing roles. Are you a 0 to 1 builder passionate about the markets and AI? See the open roles here.


