
Regional banking company F.N.B. Corporation (NYSE: FNB) announced better-than-expected revenue in Q3 CY2025, with sales up 10.6% year on year to $457 million. Its non-GAAP profit of $0.41 per share was 9.7% above analysts’ consensus estimates.
Is now the time to buy F.N.B. Corporation? Find out by accessing our full research report, it’s free for active Edge members.
F.N.B. Corporation (FNB) Q3 CY2025 Highlights:
- Net Interest Income: $359.3 million vs analyst estimates of $356.4 million (11.2% year-on-year growth, 0.8% beat)
- Net Interest Margin: 3.3% vs analyst estimates of 3.2% (4.6 basis point beat)
- Revenue: $457 million vs analyst estimates of $445.4 million (10.6% year-on-year growth, 2.6% beat)
- Efficiency Ratio: 52.4% vs analyst estimates of 54.4% (206.6 basis point beat)
- Adjusted EPS: $0.41 vs analyst estimates of $0.37 (9.7% beat)
- Tangible Book Value per Share: $11.48 vs analyst estimates of $11.40 (11.1% year-on-year growth, 0.7% beat)
- Market Capitalization: $5.67 billion
"F.N.B. Corporation reported record earnings per diluted common share of $0.41, a 37% increase from the year-ago quarter and 14% increase from the prior quarter, with revenue of $457 million principally driven by growth in net interest income, margin expansion and record non-interest income. Pre-provision net revenue (non-GAAP) grew 11% linked-quarter contributing to positive operating leverage and a peer-leading efficiency ratio (non-GAAP) of 52%," said F.N.B. Corporation Chairman, President and Chief Executive Officer, Vincent J. Delie, Jr.
Company Overview
Tracing its roots back to 1864 during the Civil War era, F.N.B. Corporation (NYSE: FNB) is a diversified financial services holding company that provides banking, wealth management, and insurance services to consumers and businesses across seven states and Washington, D.C.
Sales Growth
Two primary revenue streams drive bank earnings. While net interest income, which is earned by charging higher rates on loans than paid on deposits, forms the foundation, fee-based services across banking, credit, wealth management, and trading operations provide additional income. Luckily, F.N.B. Corporation’s revenue grew at a decent 6.7% compounded annual growth rate over the last five years. Its growth was slightly above the average banking company and shows its offerings resonate with customers.
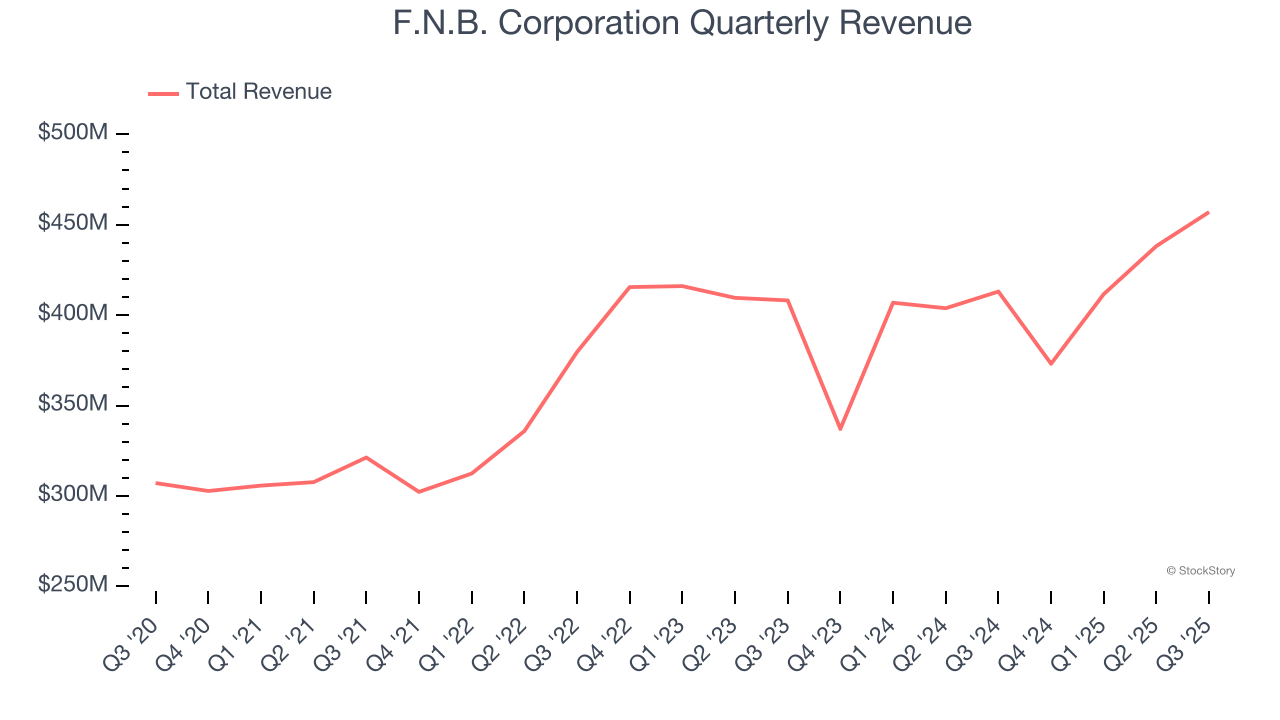
We at StockStory place the most emphasis on long-term growth, but within financials, a half-decade historical view may miss recent interest rate changes, market returns, and industry trends. F.N.B. Corporation’s recent performance shows its demand has slowed as its revenue was flat over the last two years. 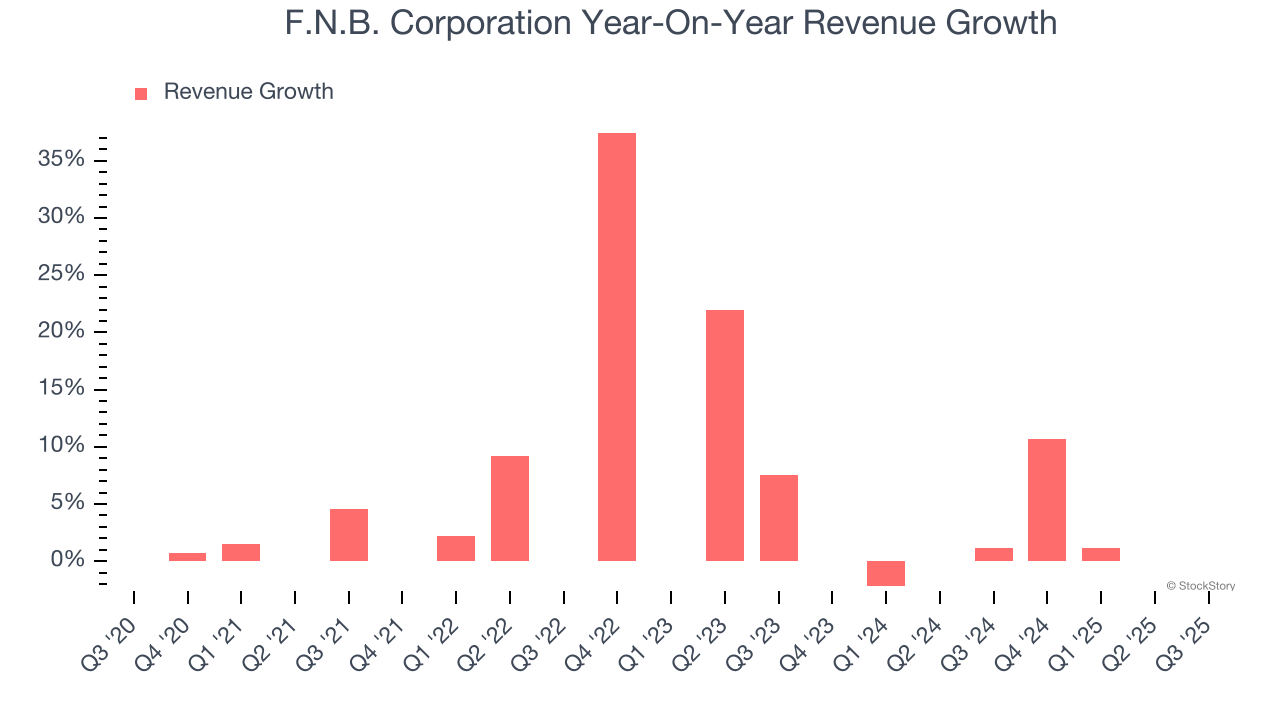 Note: Quarters not shown were determined to be outliers, impacted by outsized investment gains/losses that are not indicative of the recurring fundamentals of the business.
This quarter, F.N.B. Corporation reported year-on-year revenue growth of 10.6%, and its $457 million of revenue exceeded Wall Street’s estimates by 2.6%.
Net interest income made up 78.8% of the company’s total revenue during the last five years, meaning lending operations are F.N.B. Corporation’s largest source of revenue.
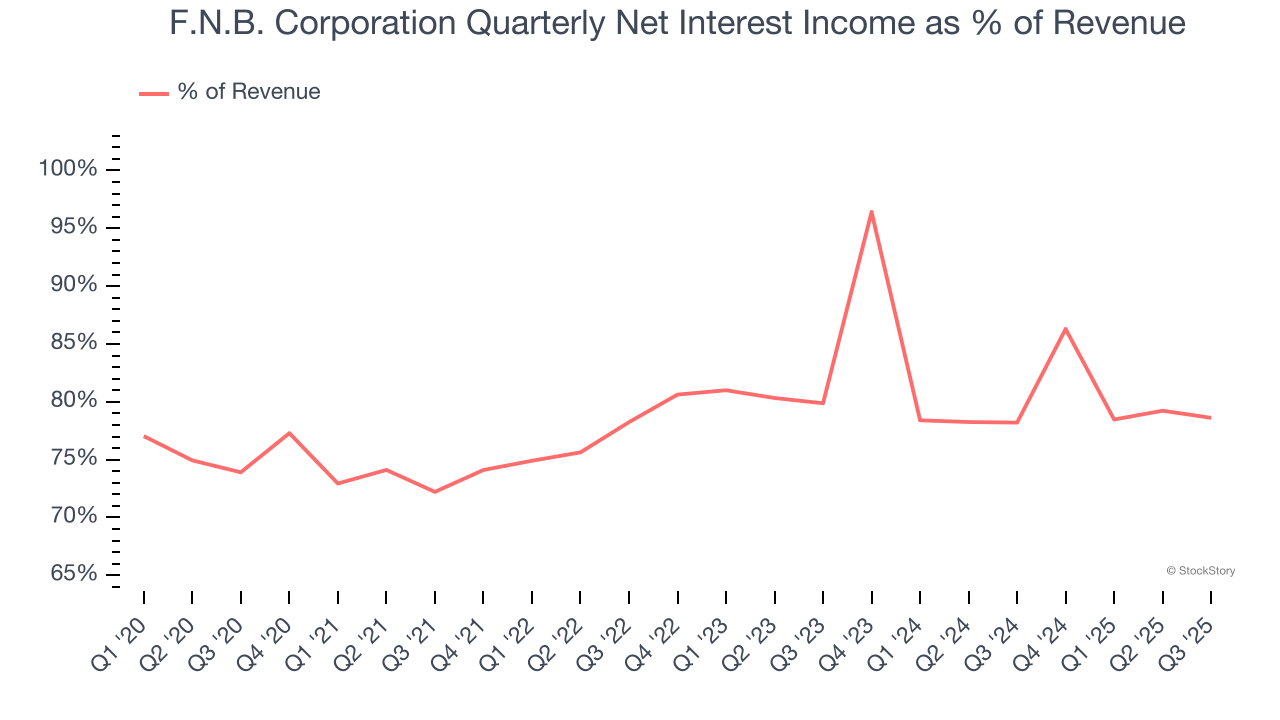
Net interest income commands greater market attention due to its reliability and consistency, whereas non-interest income is often seen as lower-quality revenue that lacks the same dependable characteristics.
Unless you’ve been living under a rock, it should be obvious by now that generative AI is going to have a huge impact on how large corporations do business. While Nvidia and AMD are trading close to all-time highs, we prefer a lesser-known (but still profitable) stock benefiting from the rise of AI. Click here to access our free report one of our favorites growth stories.
Tangible Book Value Per Share (TBVPS)
Banks profit by intermediating between depositors and borrowers, making them fundamentally balance sheet-driven enterprises. Market participants emphasize balance sheet quality and sustained book value growth when evaluating these institutions.
When analyzing banks, tangible book value per share (TBVPS) takes precedence over many other metrics. This measure isolates genuine per-share value by removing intangible assets of debatable liquidation worth. Traditional metrics like EPS are helpful but face distortion from M&A activity and loan loss accounting rules.
F.N.B. Corporation’s TBVPS grew at an excellent 8% annual clip over the last five years. TBVPS growth has also accelerated recently, growing by 12.8% annually over the last two years from $9.02 to $11.48 per share.
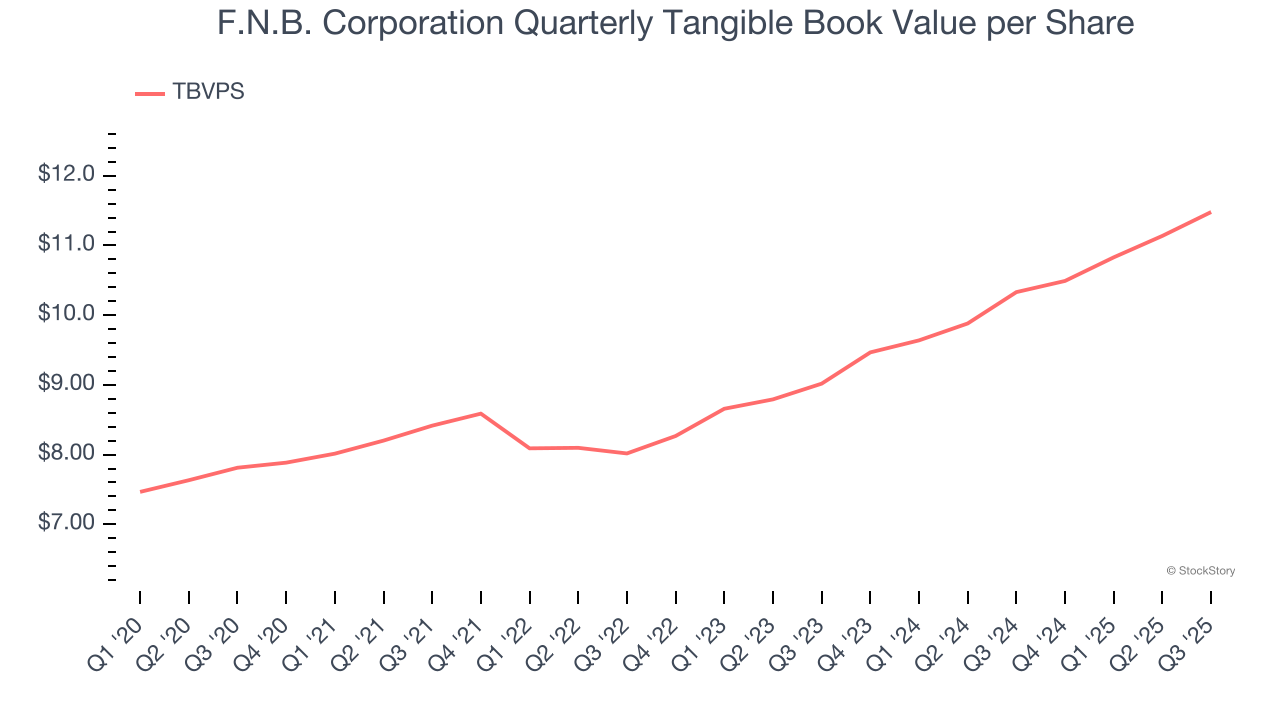
Over the next 12 months, Consensus estimates call for F.N.B. Corporation’s TBVPS to grow by 9.1% to $12.52, decent growth rate.
Key Takeaways from F.N.B. Corporation’s Q3 Results
We enjoyed seeing F.N.B. Corporation beat analysts’ revenue expectations this quarter. We were also glad its EPS outperformed Wall Street’s estimates. Overall, we think this was a decent quarter with some key metrics above expectations. The stock remained flat at $14.80 immediately following the results.
F.N.B. Corporation had an encouraging quarter, but one earnings result doesn’t necessarily make the stock a buy. Let’s see if this is a good investment. The latest quarter does matter, but not nearly as much as longer-term fundamentals and valuation, when deciding if the stock is a buy. We cover that in our actionable full research report which you can read here, it’s free for active Edge members.


