
Regional banking company KeyCorp (NYSE: KEY) announced better-than-expected revenue in Q3 CY2025, with sales up 177% year on year to $1.90 billion. Its non-GAAP profit of $0.41 per share was 7.6% above analysts’ consensus estimates.
Is now the time to buy KeyCorp? Find out by accessing our full research report, it’s free for active Edge members.
KeyCorp (KEY) Q3 CY2025 Highlights:
- Net Interest Income: $1.19 billion vs analyst estimates of $1.18 billion (25.3% year-on-year growth, 1% beat)
- Net Interest Margin: 2.8% vs analyst estimates of 2.7% (in line)
- Revenue: $1.90 billion vs analyst estimates of $1.88 billion (177% year-on-year growth, 0.9% beat)
- Efficiency Ratio: 61.8% vs analyst estimates of 62.9% (110.7 basis point beat)
- Adjusted EPS: $0.41 vs analyst estimates of $0.38 (7.6% beat)
- Tangible Book Value per Share: $13.38 vs analyst estimates of $13.05 (14.7% year-on-year growth, 2.5% beat)
- Market Capitalization: $19.44 billion
Company Overview
Tracing its roots back to 1849 during the California Gold Rush era, KeyCorp (NYSE: KEY) operates KeyBank, a full-service regional bank providing retail and commercial banking, wealth management, and investment services across 15 states.
Sales Growth
Two primary revenue streams drive bank earnings. While net interest income, which is earned by charging higher rates on loans than paid on deposits, forms the foundation, fee-based services across banking, credit, wealth management, and trading operations provide additional income. Unfortunately, KeyCorp struggled to consistently increase demand as its $6.35 billion of revenue for the trailing 12 months was close to its revenue five years ago. This was below our standards and is a poor baseline for our analysis.
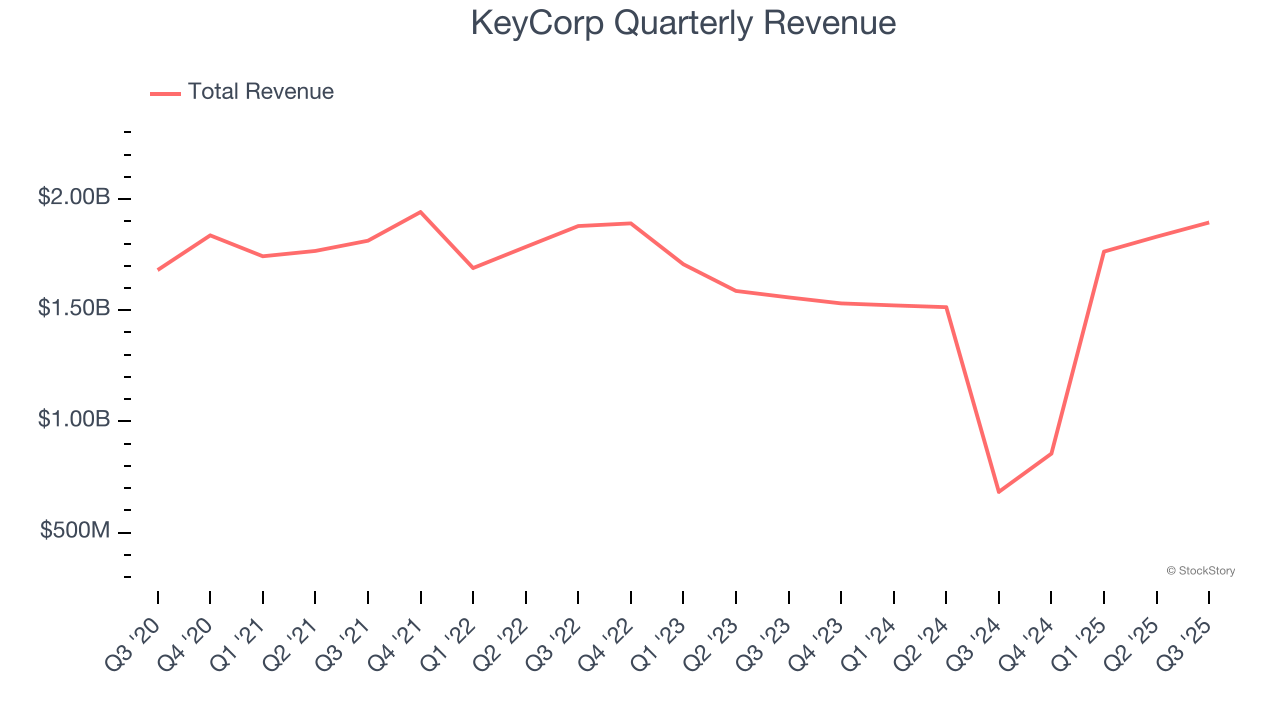
Long-term growth is the most important, but within financials, a half-decade historical view may miss recent interest rate changes and market returns. KeyCorp’s recent performance shows its demand remained suppressed as its revenue has declined by 3% annually over the last two years. 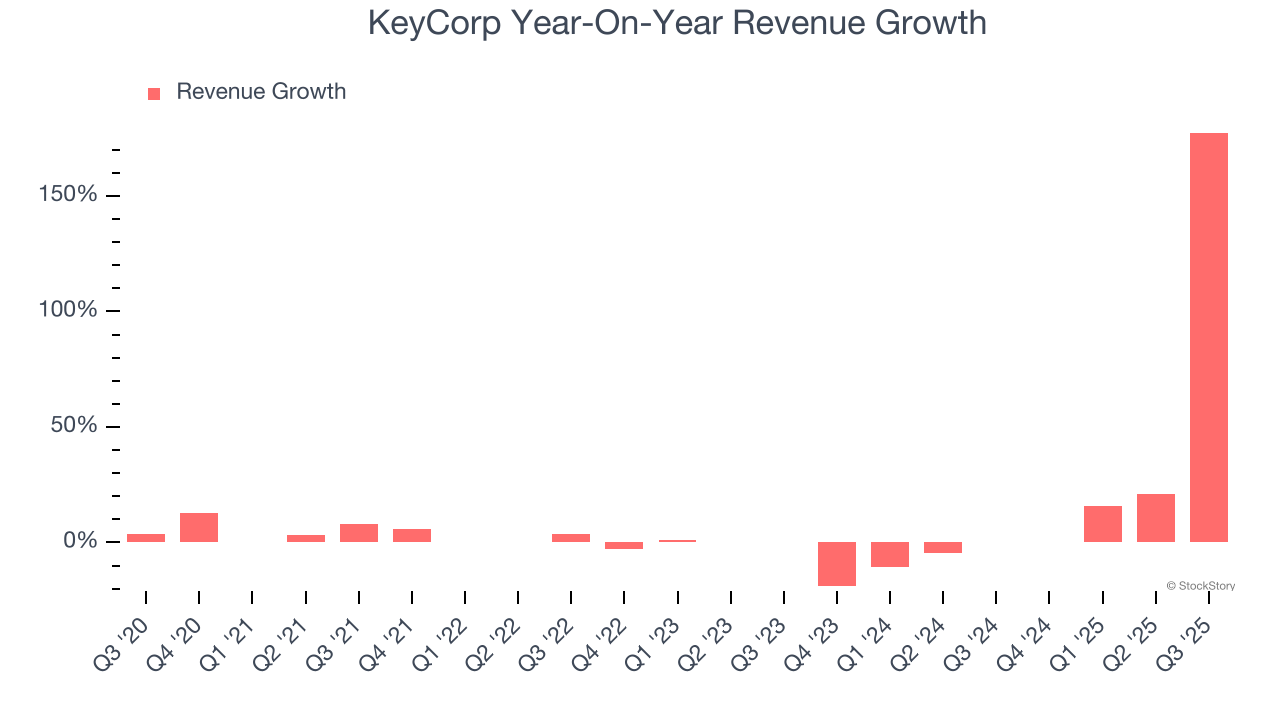 Note: Quarters not shown were determined to be outliers, impacted by outsized investment gains/losses that are not indicative of the recurring fundamentals of the business.
This quarter, KeyCorp reported magnificent year-on-year revenue growth of 177%, and its $1.90 billion of revenue beat Wall Street’s estimates by 0.9%.
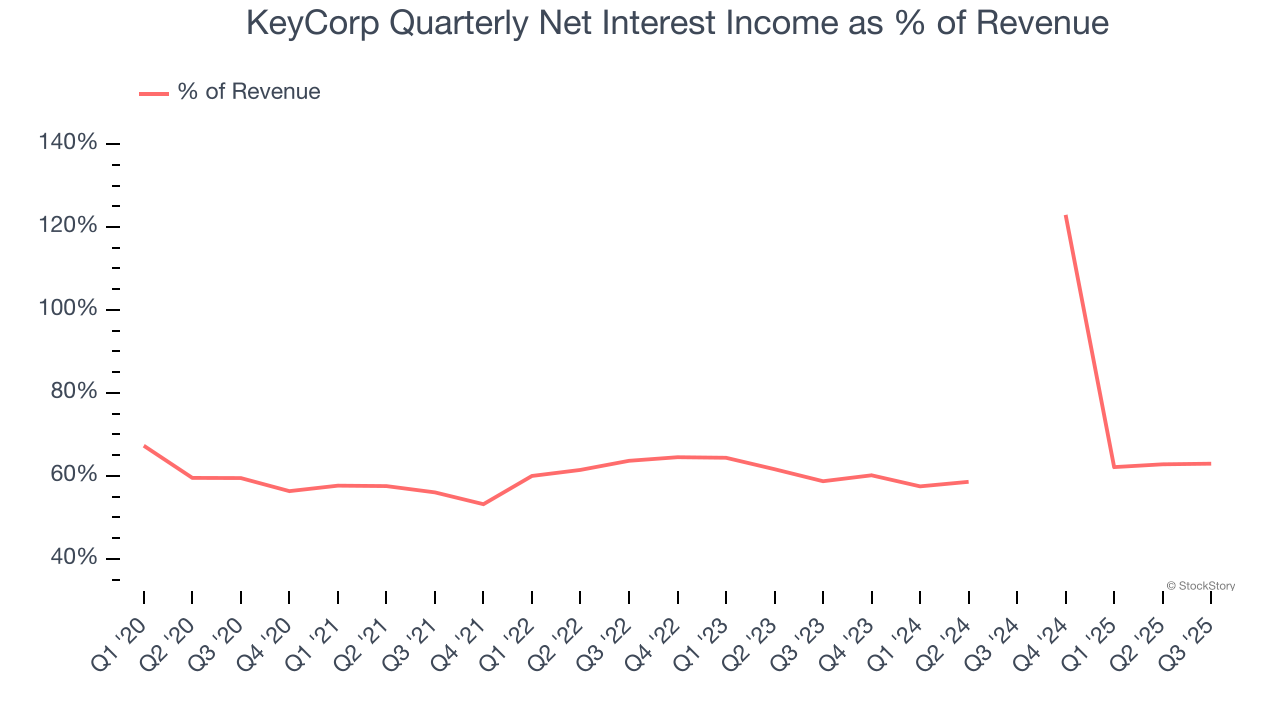
Net interest income made up 67.1% of the company’s total revenue during the last five years, meaning lending operations are KeyCorp’s largest source of revenue.
 Note: Quarters not shown were determined to be outliers, impacted by outsized investment gains/losses that are not indicative of the recurring fundamentals of the business.
Markets consistently prioritize net interest income growth over fee-based revenue, recognizing its superior quality and recurring nature compared to the more unpredictable non-interest income streams.
Today’s young investors won’t have read the timeless lessons in Gorilla Game: Picking Winners In High Technology because it was written more than 20 years ago when Microsoft and Apple were first establishing their supremacy. But if we apply the same principles, then enterprise software stocks leveraging their own generative AI capabilities may well be the Gorillas of the future. So, in that spirit, we are excited to present our Special Free Report on a profitable, fast-growing enterprise software stock that is already riding the automation wave and looking to catch the generative AI next.
Tangible Book Value Per Share (TBVPS)
Banks are balance sheet-driven businesses because they generate earnings primarily through borrowing and lending. They’re also valued based on their balance sheet strength and ability to compound book value (another name for shareholders’ equity) over time.
Because of this, tangible book value per share (TBVPS) emerges as the critical performance benchmark. By excluding intangible assets with uncertain liquidation values, this metric captures real, liquid net worth per share. EPS can become murky due to acquisition impacts or accounting flexibility around loan provisions, and TBVPS resists financial engineering manipulation.
KeyCorp’s TBVPS was flat over the last five years. However, TBVPS growth has accelerated recently, growing by 24.8% annually over the last two years from $8.59 to $13.38 per share.
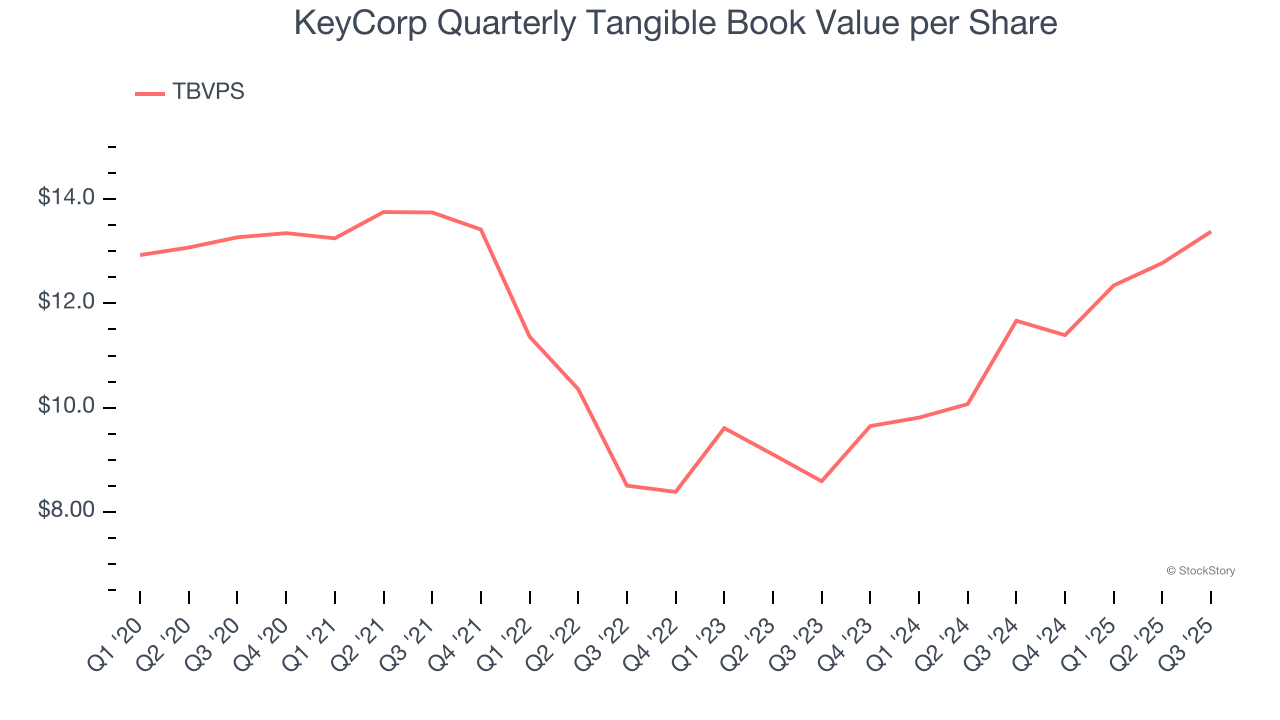
Over the next 12 months, Consensus estimates call for KeyCorp’s TBVPS to grow by 4.6% to $13.99, paltry growth rate.
Key Takeaways from KeyCorp’s Q3 Results
We enjoyed seeing KeyCorp beat analysts’ tangible book value per share expectations this quarter. We were also happy its net interest income narrowly outperformed Wall Street’s estimates. Overall, this print had some key positives. The stock remained flat at $17.85 immediately after reporting.
Indeed, KeyCorp had a rock-solid quarterly earnings result, but is this stock a good investment here? What happened in the latest quarter matters, but not as much as longer-term business quality and valuation, when deciding whether to invest in this stock. We cover that in our actionable full research report which you can read here, it’s free for active Edge members.