Regional banking company M&T Bank (NYSE: MTB) reported revenue ahead of Wall Street’s expectations in Q3 CY2025, with sales up 8.3% year on year to $2.53 billion. Its GAAP profit of $4.82 per share was 8.9% above analysts’ consensus estimates.
Is now the time to buy M&T Bank? Find out by accessing our full research report, it’s free for active Edge members.
M&T Bank (MTB) Q3 CY2025 Highlights:
- Net Interest Income: $1.77 billion vs analyst estimates of $1.78 billion (2.7% year-on-year growth, in line)
- Net Interest Margin: 3.7% vs analyst estimates of 3.7% (in line)
- Revenue: $2.53 billion vs analyst estimates of $2.43 billion (8.3% year-on-year growth, 3.7% beat)
- Efficiency Ratio: 53.6% vs analyst estimates of 54.4% (79.4 basis point beat)
- EPS (GAAP): $4.82 vs analyst estimates of $4.43 (8.9% beat)
- Tangible Book Value per Share: $115.31 vs analyst estimates of $113.76 (7% year-on-year growth, 1.4% beat)
- Market Capitalization: $28.91 billion
Company Overview
Tracing its roots back to 1856 when it was founded as Manufacturers and Traders Bank in Buffalo, New York, M&T Bank (NYSE: MTB) is a regional bank holding company that provides retail and commercial banking, trust, wealth management, and investment services to consumers and businesses.
Sales Growth
Two primary revenue streams drive bank earnings. While net interest income, which is earned by charging higher rates on loans than paid on deposits, forms the foundation, fee-based services across banking, credit, wealth management, and trading operations provide additional income. Thankfully, M&T Bank’s 10.1% annualized revenue growth over the last five years was impressive. Its growth beat the average banking company and shows its offerings resonate with customers.
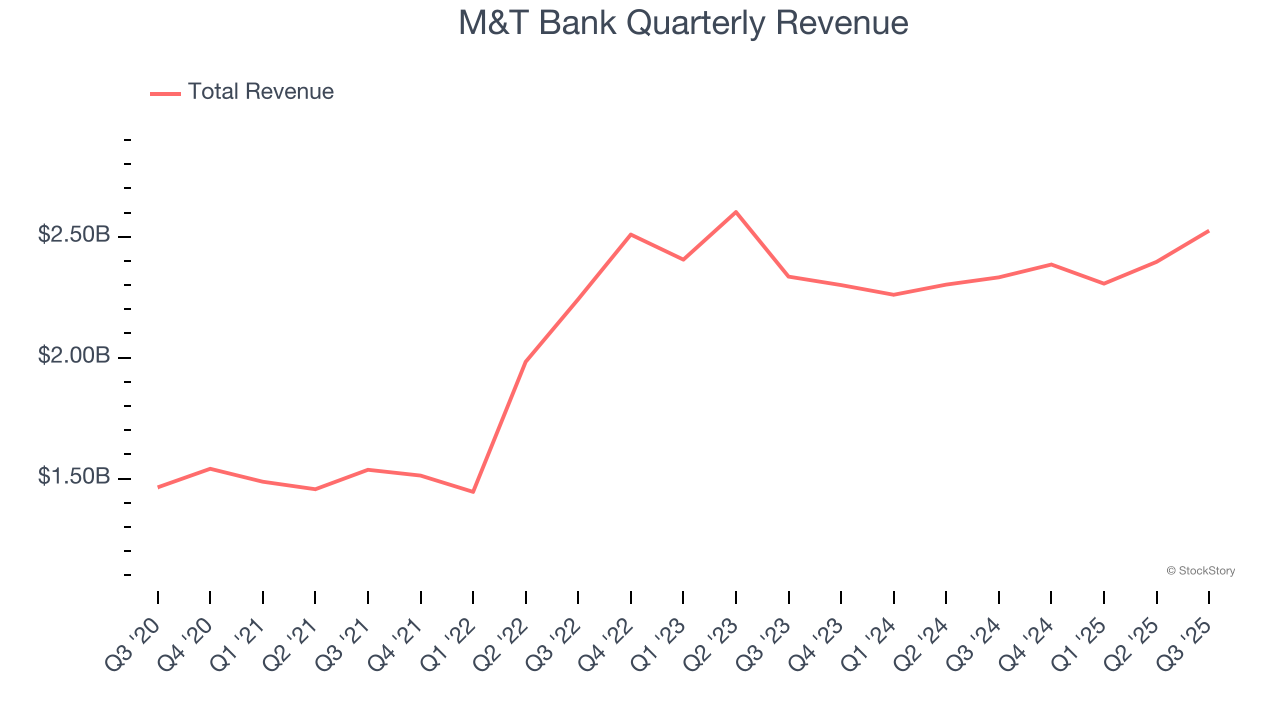
Long-term growth is the most important, but within financials, a half-decade historical view may miss recent interest rate changes and market returns. M&T Bank’s recent performance marks a sharp pivot from its five-year trend as its revenue has shown annualized declines of 1.2% over the last two years. 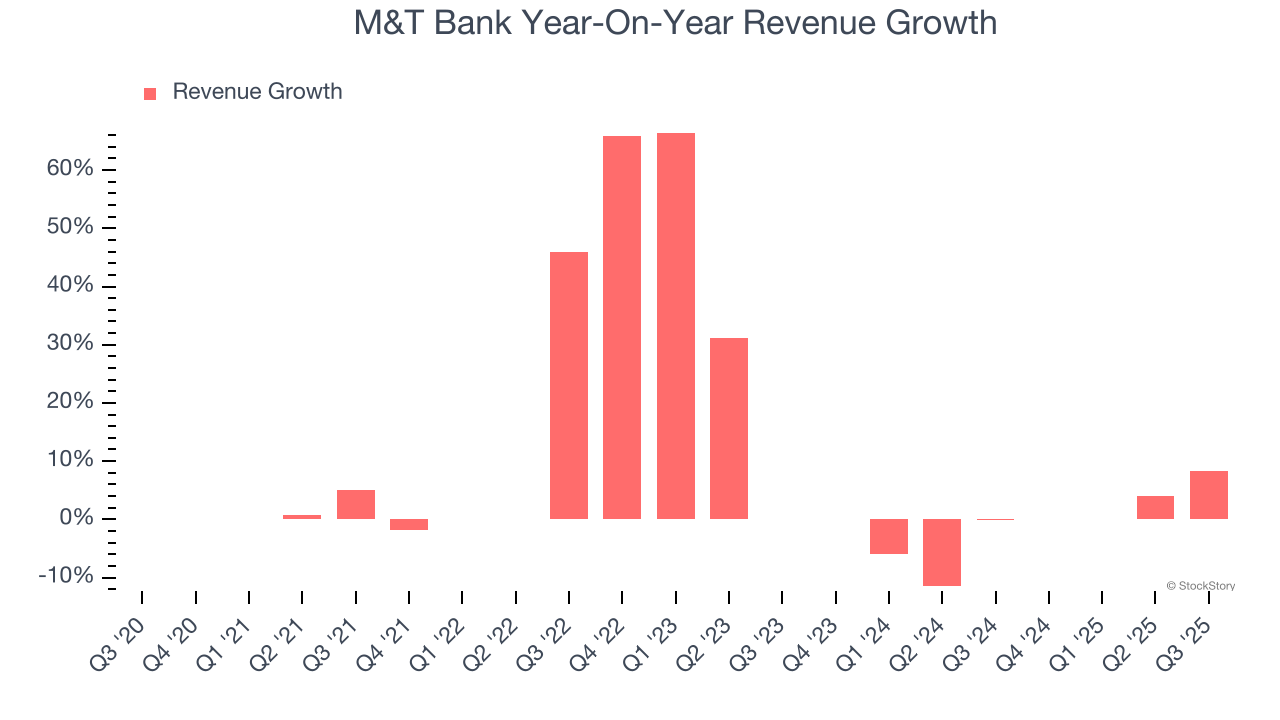 Note: Quarters not shown were determined to be outliers, impacted by outsized investment gains/losses that are not indicative of the recurring fundamentals of the business.
This quarter, M&T Bank reported year-on-year revenue growth of 8.3%, and its $2.53 billion of revenue exceeded Wall Street’s estimates by 3.7%.
Net interest income made up 70.4% of the company’s total revenue during the last five years, meaning lending operations are M&T Bank’s largest source of revenue.
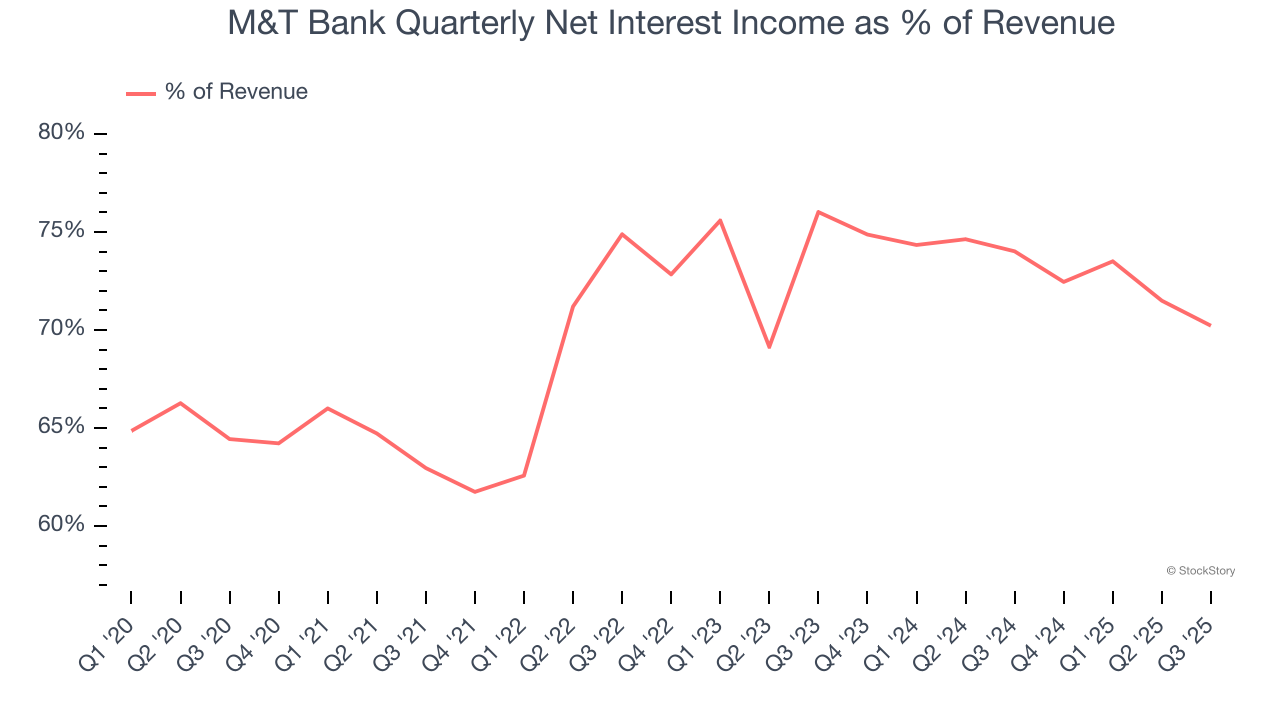
Markets consistently prioritize net interest income growth over fee-based revenue, recognizing its superior quality and recurring nature compared to the more unpredictable non-interest income streams.
Here at StockStory, we certainly understand the potential of thematic investing. Diverse winners from Microsoft (MSFT) to Alphabet (GOOG), Coca-Cola (KO) to Monster Beverage (MNST) could all have been identified as promising growth stories with a megatrend driving the growth. So, in that spirit, we’ve identified a relatively under-the-radar profitable growth stock benefiting from the rise of AI, available to you FREE via this link.
Tangible Book Value Per Share (TBVPS)
Banks are balance sheet-driven businesses because they generate earnings primarily through borrowing and lending. They’re also valued based on their balance sheet strength and ability to compound book value (another name for shareholders’ equity) over time.
Because of this, tangible book value per share (TBVPS) emerges as the critical performance benchmark. By excluding intangible assets with uncertain liquidation values, this metric captures real, liquid net worth per share. EPS can become murky due to acquisition impacts or accounting flexibility around loan provisions, and TBVPS resists financial engineering manipulation.
M&T Bank’s TBVPS grew at an impressive 7.6% annual clip over the last five years. TBVPS growth has also accelerated recently, growing by 10.9% annually over the last two years from $93.75 to $115.31 per share.
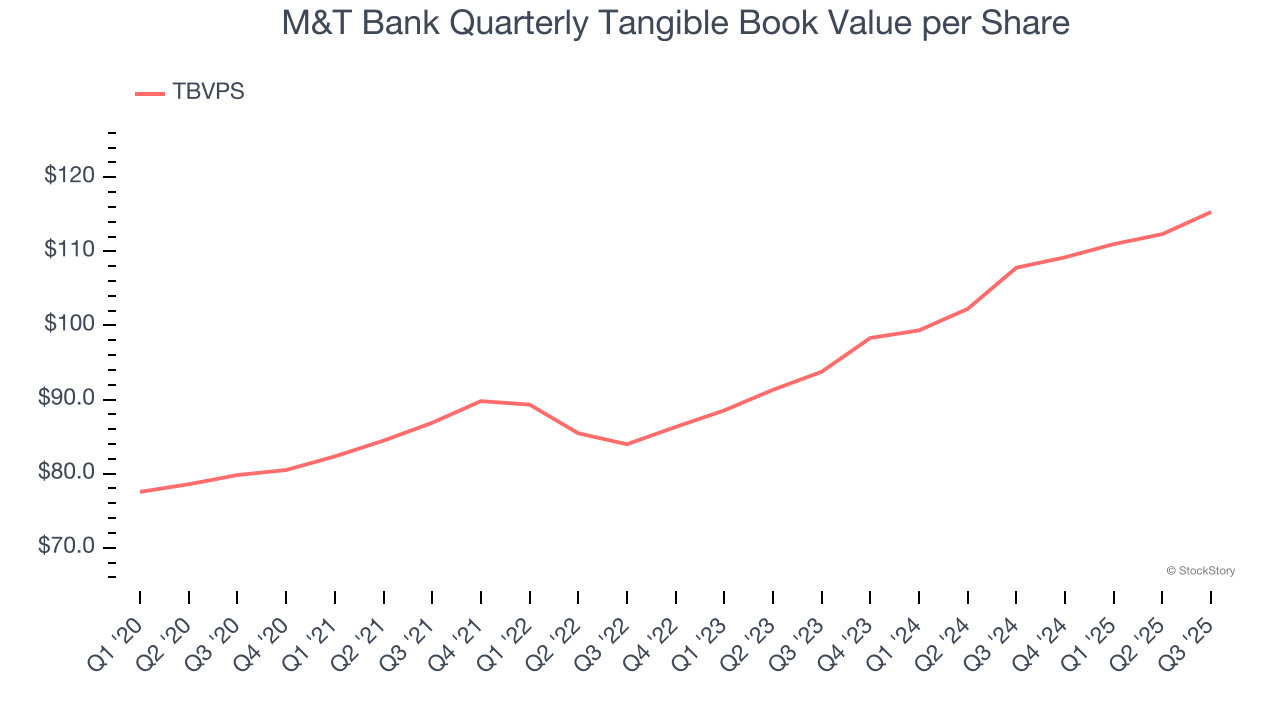
Over the next 12 months, Consensus estimates call for M&T Bank’s TBVPS to grow by 4% to $119.97, paltry growth rate.
Key Takeaways from M&T Bank’s Q3 Results
We enjoyed seeing M&T Bank beat analysts’ revenue expectations this quarter. We were also happy its tangible book value per share narrowly outperformed Wall Street’s estimates. On the other hand, its net interest income was in line. Overall, we think this was a decent quarter with some key metrics above expectations. The stock traded up 1.4% to $187.66 immediately after reporting.
M&T Bank had an encouraging quarter, but one earnings result doesn’t necessarily make the stock a buy. Let’s see if this is a good investment. If you’re making that decision, you should consider the bigger picture of valuation, business qualities, as well as the latest earnings. We cover that in our actionable full research report which you can read here, it’s free for active Edge members.