
Since October 2020, the S&P 500 has delivered a total return of 91.5%. But one standout stock has more than doubled the market - over the past five years, OSI Systems has surged 217% to $256.66 per share. Its momentum hasn’t stopped as it’s also gained 35.5% in the last six months thanks to its solid quarterly results, beating the S&P by 9%.
Is now still a good time to buy OSIS? Or are investors being too optimistic? Find out in our full research report, it’s free for active Edge members.
Why Does OSIS Stock Spark Debate?
With security scanners deployed at airports and borders worldwide and patient monitors used in hospitals across the globe, OSI Systems (NASDAQ: OSIS) designs and manufactures specialized electronic systems for security screening, patient monitoring, and optoelectronic applications.
Two Positive Attributes:
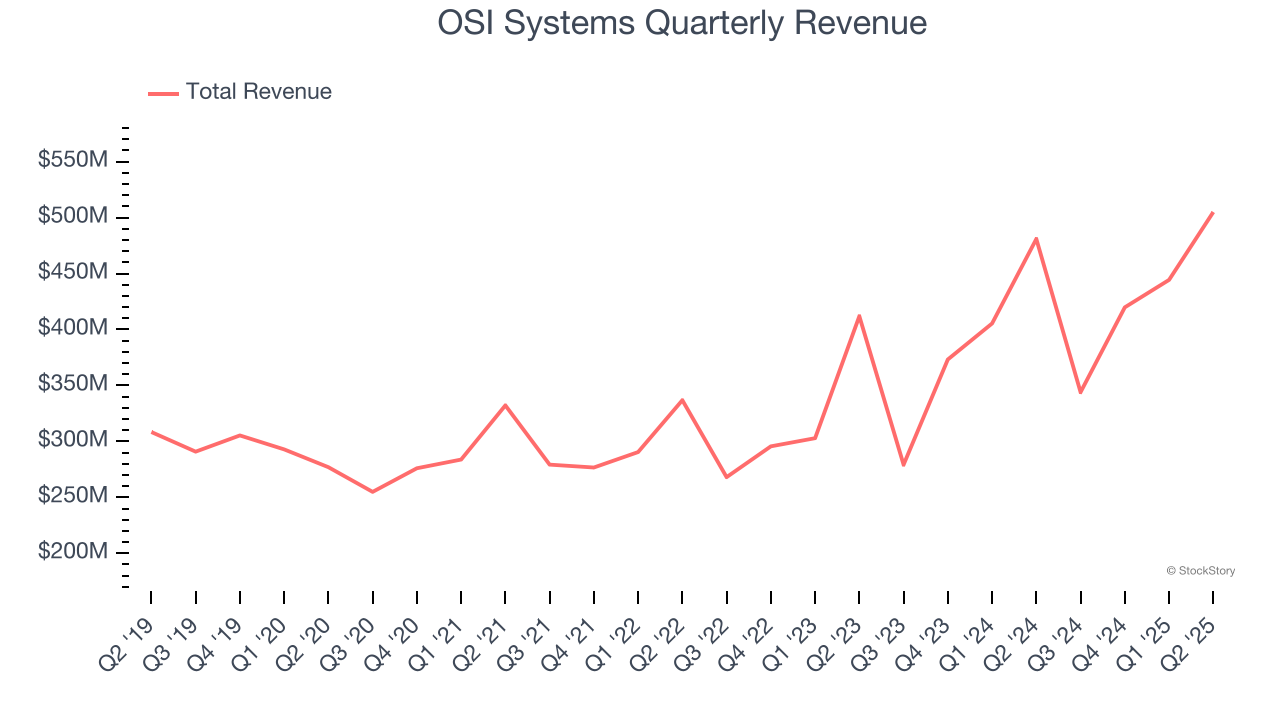
1. Long-Term Revenue Growth Shows Strong Momentum
A company’s long-term sales performance can indicate its overall quality. Even a bad business can shine for one or two quarters, but a top-tier one grows for years. Over the last five years, OSI Systems grew its sales at a solid 8% compounded annual growth rate. Its growth surpassed the average business services company and shows its offerings resonate with customers.
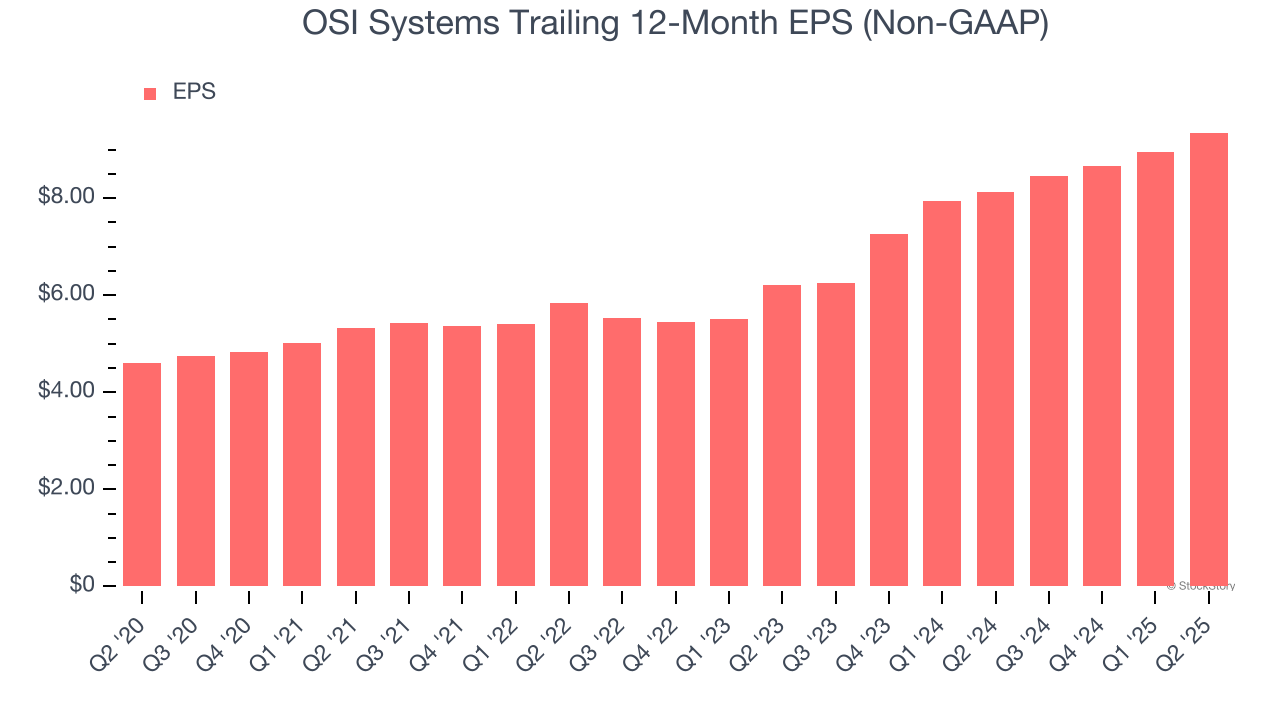
2. Outstanding Long-Term EPS Growth
We track the long-term change in earnings per share (EPS) because it highlights whether a company’s growth is profitable.
OSI Systems’s EPS grew at an astounding 15.2% compounded annual growth rate over the last five years, higher than its 8% annualized revenue growth. This tells us the company became more profitable on a per-share basis as it expanded.
One Reason to be Careful:
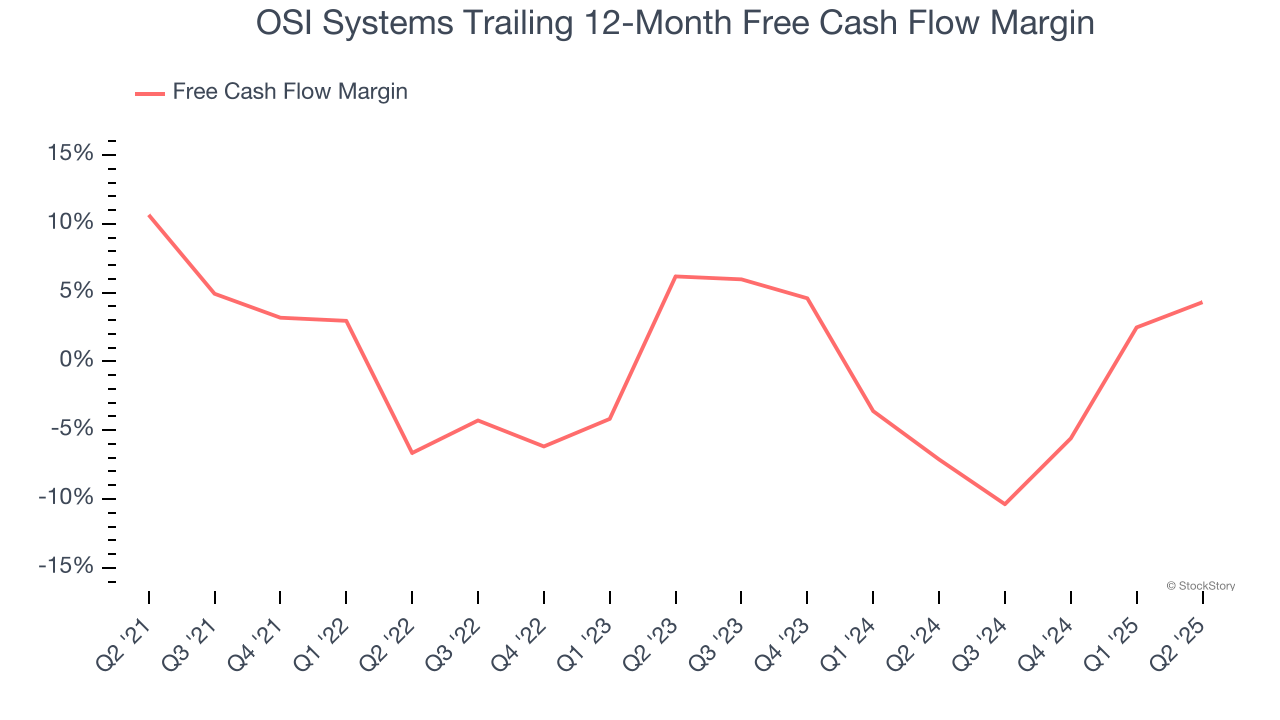
Free Cash Flow Margin Dropping
Free cash flow isn't a prominently featured metric in company financials and earnings releases, but we think it's telling because it accounts for all operating and capital expenses, making it tough to manipulate. Cash is king.
As you can see below, OSI Systems’s margin dropped by 6.3 percentage points over the last five years. It may have ticked higher more recently, but shareholders are likely hoping for its margin to at least revert to its historical level. If the longer-term trend returns, it could signal it’s in the middle of a big investment cycle. OSI Systems’s free cash flow margin for the trailing 12 months was 4.3%.
Final Judgment
OSI Systems’s positive characteristics outweigh the negatives, and with its shares outperforming the market lately, the stock trades at 25.1× forward P/E (or $256.66 per share). Is now a good time to initiate a position? See for yourself in our full research report, it’s free for active Edge members.
Stocks We Like Even More Than OSI Systems
Trump’s April 2025 tariff bombshell triggered a massive market selloff, but stocks have since staged an impressive recovery, leaving those who panic sold on the sidelines.
Take advantage of the rebound by checking out our Top 5 Growth Stocks for this month. This is a curated list of our High Quality stocks that have generated a market-beating return of 183% over the last five years (as of March 31st 2025).
Stocks that made our list in 2020 include now familiar names such as Nvidia (+1,545% between March 2020 and March 2025) as well as under-the-radar businesses like the once-small-cap company Comfort Systems (+782% five-year return). Find your next big winner with StockStory today.
StockStory is growing and hiring equity analyst and marketing roles. Are you a 0 to 1 builder passionate about the markets and AI? See the open roles here.