
Encore Capital Group’s 33.1% return over the past six months has outpaced the S&P 500 by 7.6%, and its stock price has climbed to $40.47 per share. This was partly thanks to its solid quarterly results, and the performance may have investors wondering how to approach the situation.
Is there a buying opportunity in Encore Capital Group, or does it present a risk to your portfolio? Check out our in-depth research report to see what our analysts have to say, it’s free for active Edge members.
Why Is Encore Capital Group Not Exciting?
We’re glad investors have benefited from the price increase, but we're cautious about Encore Capital Group. Here are three reasons we avoid ECPG and a stock we'd rather own.
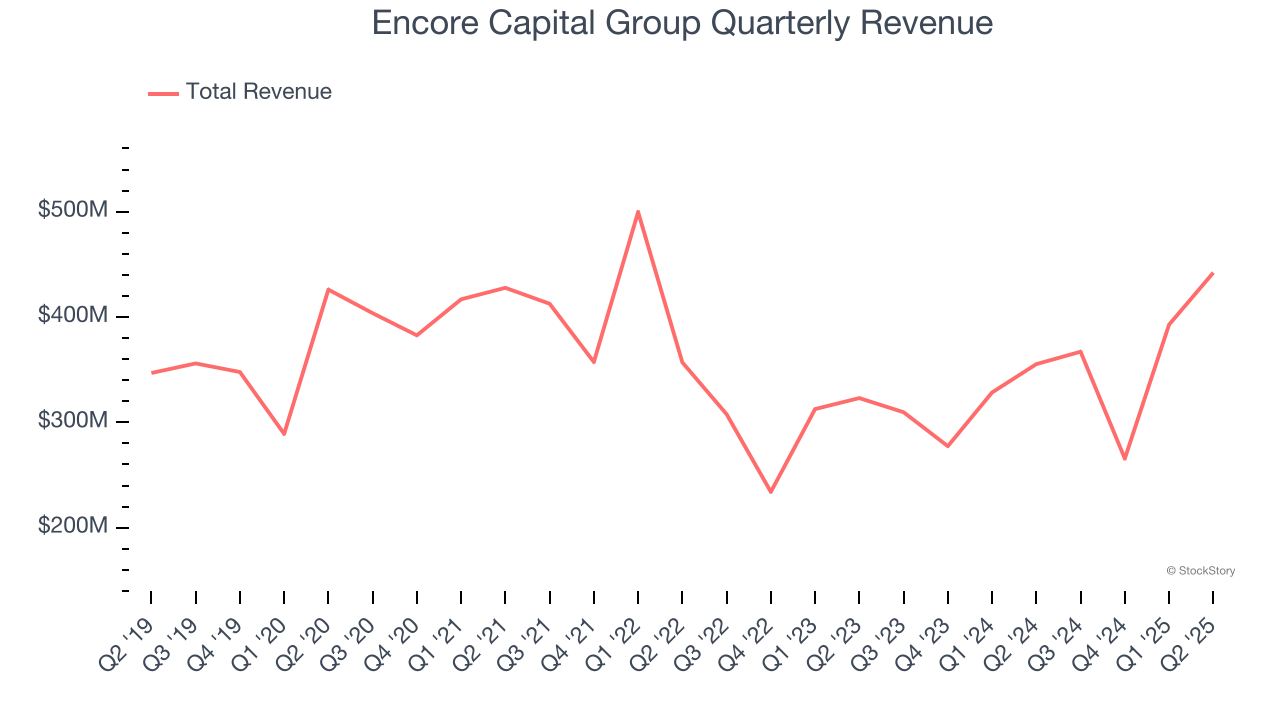
1. Long-Term Revenue Growth Flatter Than a Pancake
A company’s long-term sales performance is one signal of its overall quality. Any business can experience short-term success, but top-performing ones enjoy sustained growth for years.
Unfortunately, Encore Capital Group struggled to consistently increase demand as its $1.47 billion of revenue for the trailing 12 months was close to its revenue five years ago. This wasn’t a great result and is a sign of lacking business quality.
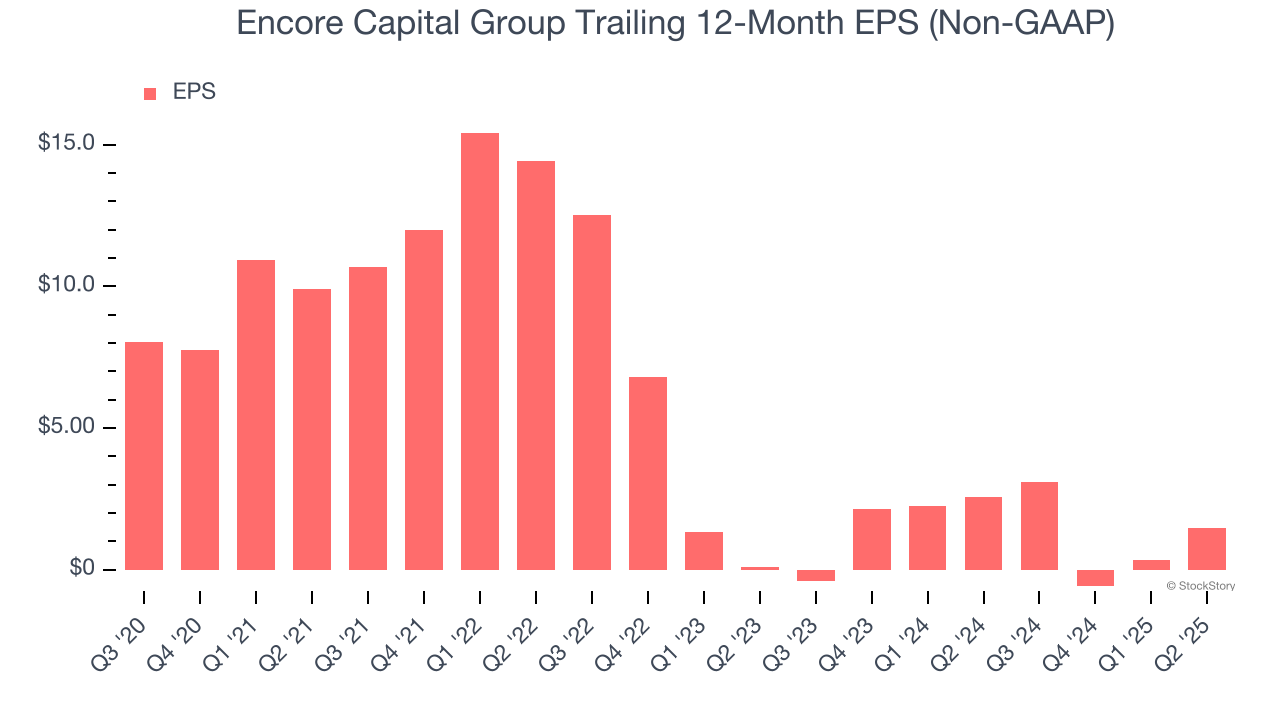
2. EPS Trending Down
Analyzing the long-term change in earnings per share (EPS) shows whether a company's incremental sales were profitable – for example, revenue could be inflated through excessive spending on advertising and promotions.
Sadly for Encore Capital Group, its EPS declined by 49% annually over the last five years while its revenue was flat. This tells us the company struggled because its fixed cost base made it difficult to adjust to choppy demand.
3. High Debt Levels Increase Risk
Encore Capital Group reported $172.9 million of cash and $3.97 billion of debt on its balance sheet in the most recent quarter.
As investors in high-quality companies, we primarily focus on whether a company’s profits can support its debt.
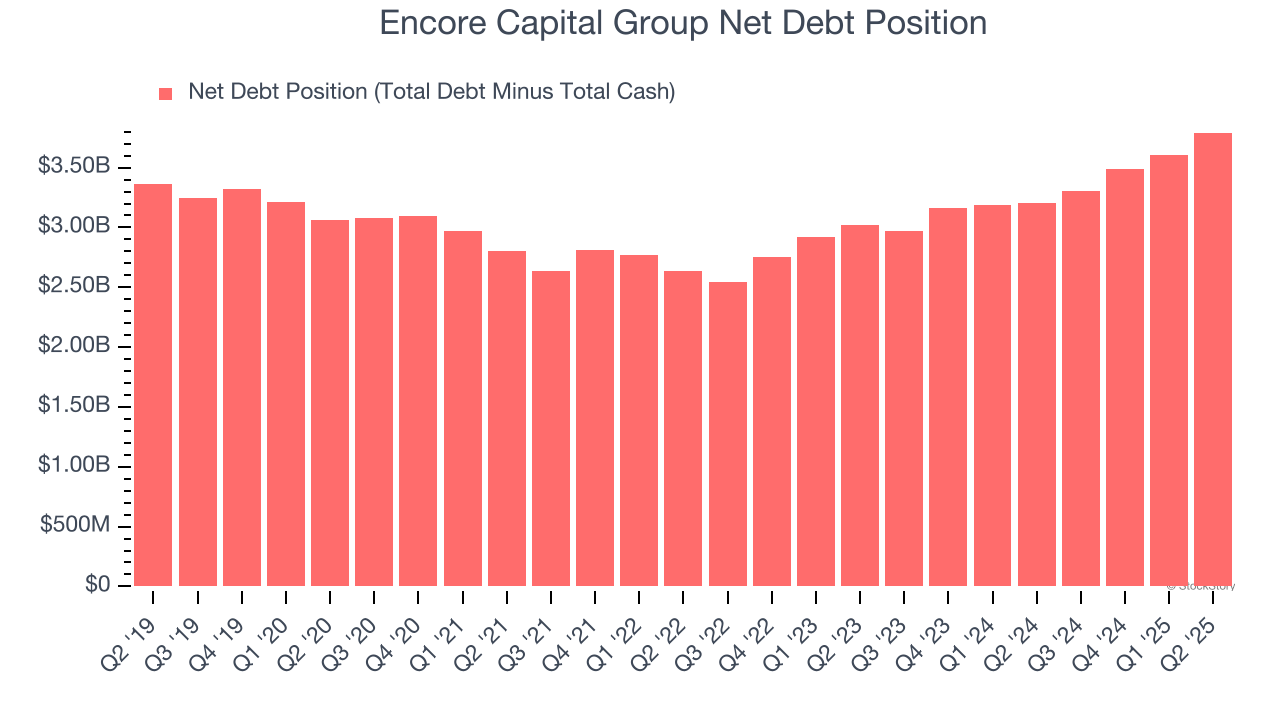
With $283.8 million of EBITDA over the last 12 months, we view Encore Capital Group’s 13.4× net-debt-to-EBITDA ratio as inadequate. The company’s lacking profits relative to its borrowings give it little breathing room, raising red flags.
Final Judgment
Encore Capital Group isn’t a terrible business, but it doesn’t pass our quality test. With its shares outperforming the market lately, the stock trades at 6.1× forward P/E (or $40.47 per share). While this valuation is optically cheap, the potential downside is big given its shaky fundamentals. We're pretty confident there are more exciting stocks to buy at the moment. Let us point you toward a fast-growing restaurant franchise with an A+ ranch dressing sauce.
Stocks We Would Buy Instead of Encore Capital Group
Donald Trump’s April 2025 "Liberation Day" tariffs sent markets into a tailspin, but stocks have since rebounded strongly, proving that knee-jerk reactions often create the best buying opportunities.
The smart money is already positioning for the next leg up. Don’t miss out on the recovery - check out our Top 5 Growth Stocks for this month. This is a curated list of our High Quality stocks that have generated a market-beating return of 183% over the last five years (as of March 31st 2025).
Stocks that made our list in 2020 include now familiar names such as Nvidia (+1,545% between March 2020 and March 2025) as well as under-the-radar businesses like the once-small-cap company Comfort Systems (+782% five-year return). Find your next big winner with StockStory today.
StockStory is growing and hiring equity analyst and marketing roles. Are you a 0 to 1 builder passionate about the markets and AI? See the open roles here.


