
Over the last six months, Saia’s shares have sunk to $302.50, producing a disappointing 9.6% loss - a stark contrast to the S&P 500’s 25.5% gain. This may have investors wondering how to approach the situation.
Is now the time to buy Saia, or should you be careful about including it in your portfolio? See what our analysts have to say in our full research report, it’s free for active Edge members.
Why Is Saia Not Exciting?
Despite the more favorable entry price, we're sitting this one out for now. Here are three reasons why SAIA doesn't excite us and a stock we'd rather own.
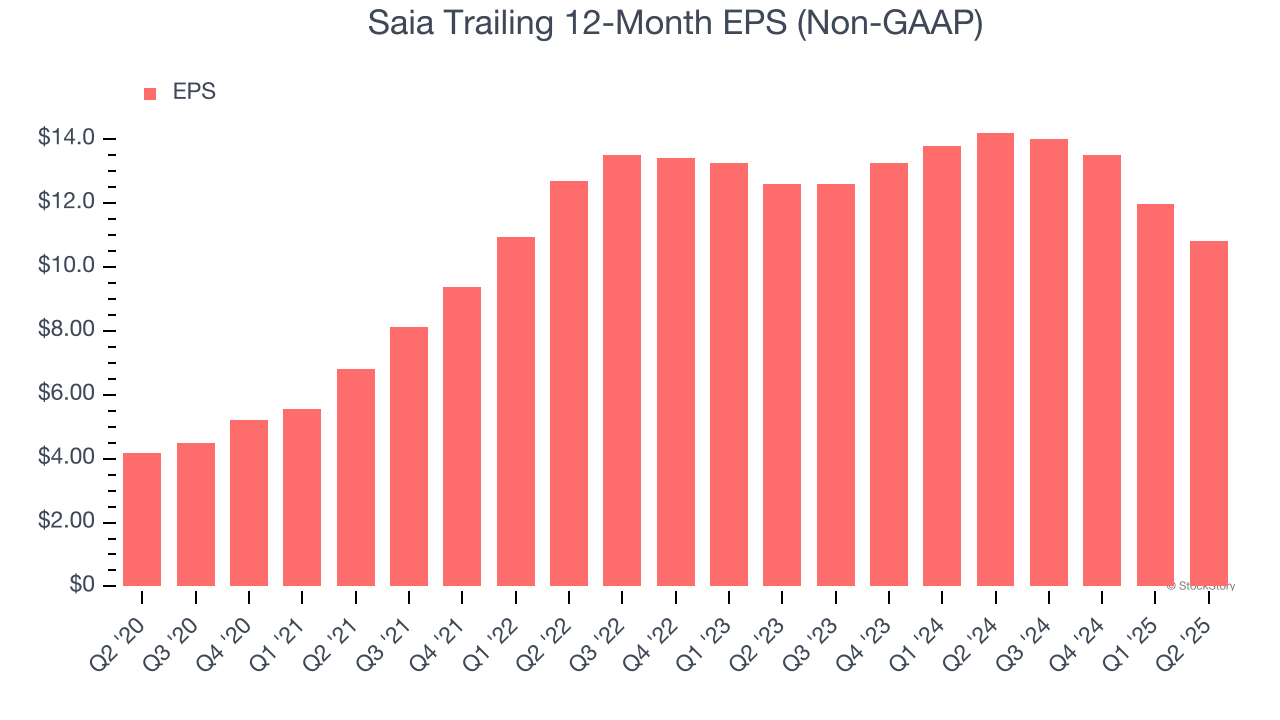
1. EPS Took a Dip Over the Last Two Years
Although long-term earnings trends give us the big picture, we like to analyze EPS over a shorter period to see if we are missing a change in the business.
Sadly for Saia, its EPS declined by 7.3% annually over the last two years while its revenue grew by 8.7%. This tells us the company became less profitable on a per-share basis as it expanded.
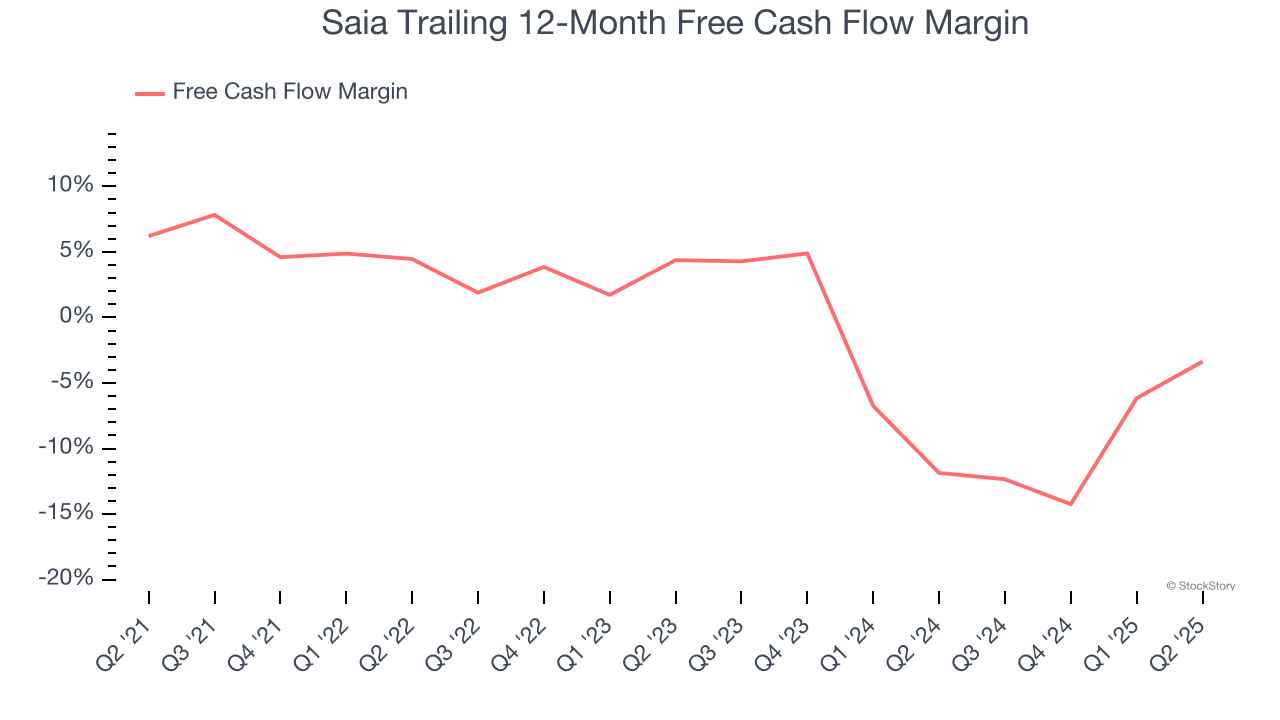
2. Free Cash Flow Margin Dropping
If you’ve followed StockStory for a while, you know we emphasize free cash flow. Why, you ask? We believe that in the end, cash is king, and you can’t use accounting profits to pay the bills.
As you can see below, Saia’s margin dropped by 9.6 percentage points over the last five years. It may have ticked higher more recently, but shareholders are likely hoping for its margin to at least revert to its historical level. Almost any movement in the wrong direction is undesirable because of its already low cash conversion. If the longer-term trend returns, it could signal it’s becoming a more capital-intensive business. Saia’s free cash flow margin for the trailing 12 months was negative 3.4%.
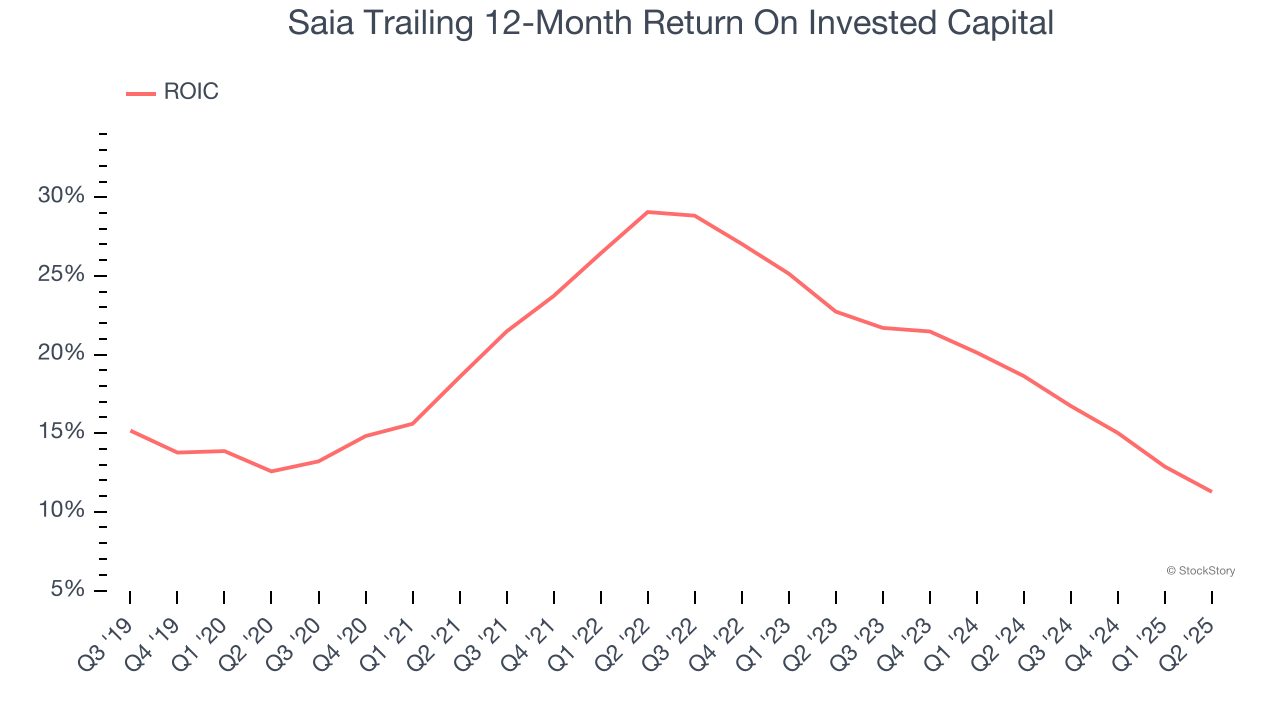
3. New Investments Fail to Bear Fruit as ROIC Declines
A company’s ROIC, or return on invested capital, shows how much operating profit it makes compared to the money it has raised (debt and equity).
We like to invest in businesses with high returns, but the trend in a company’s ROIC is what often surprises the market and moves the stock price. Unfortunately, Saia’s ROIC has decreased over the last few years. We like what management has done in the past, but its declining returns are perhaps a symptom of fewer profitable growth opportunities.
Final Judgment
Saia’s business quality ultimately falls short of our standards. Following the recent decline, the stock trades at 30.3× forward P/E (or $302.50 per share). Beauty is in the eye of the beholder, but our analysis shows the upside isn’t great compared to the potential downside. We're fairly confident there are better stocks to buy right now. We’d recommend looking at one of our all-time favorite software stocks.
Stocks We Like More Than Saia
Trump’s April 2025 tariff bombshell triggered a massive market selloff, but stocks have since staged an impressive recovery, leaving those who panic sold on the sidelines.
Take advantage of the rebound by checking out our Top 9 Market-Beating Stocks. This is a curated list of our High Quality stocks that have generated a market-beating return of 183% over the last five years (as of March 31st 2025).
Stocks that made our list in 2020 include now familiar names such as Nvidia (+1,545% between March 2020 and March 2025) as well as under-the-radar businesses like the once-small-cap company Comfort Systems (+782% five-year return). Find your next big winner with StockStory today.
StockStory is growing and hiring equity analyst and marketing roles. Are you a 0 to 1 builder passionate about the markets and AI? See the open roles here.


