
Matrix Service currently trades at $12.89 per share and has shown little upside over the past six months, posting a middling return of 2.4%. The stock also fell short of the S&P 500’s 18.4% gain during that period.
Is now the time to buy Matrix Service, or should you be careful about including it in your portfolio? Check out our in-depth research report to see what our analysts have to say, it’s free.
Why Do We Think Matrix Service Will Underperform?
We don't have much confidence in Matrix Service. Here are three reasons there are better opportunities than MTRX and a stock we'd rather own.
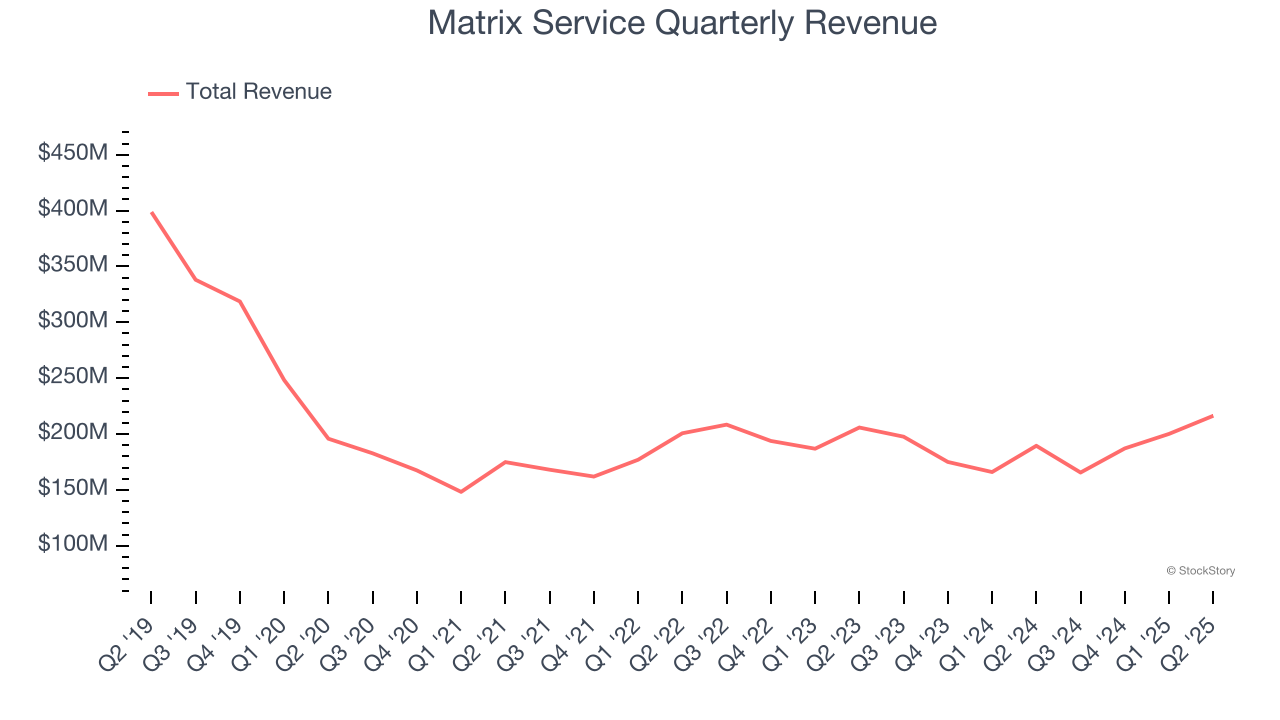
1. Revenue Spiraling Downwards
A company’s long-term performance is an indicator of its overall quality. Any business can put up a good quarter or two, but the best consistently grow over the long haul. Over the last five years, Matrix Service’s demand was weak and its revenue declined by 6.9% per year. This was below our standards and signals it’s a low quality business.
2. Low Gross Margin Reveals Weak Structural Profitability
Cost of sales for an industrials business is usually comprised of the direct labor, raw materials, and supplies needed to offer a product or service. These costs can be impacted by inflation and supply chain dynamics.
Matrix Service has bad unit economics for an industrials business, signaling it operates in a competitive market. As you can see below, it averaged a 3.9% gross margin over the last five years. That means Matrix Service paid its suppliers a lot of money ($96.12 for every $100 in revenue) to run its business. 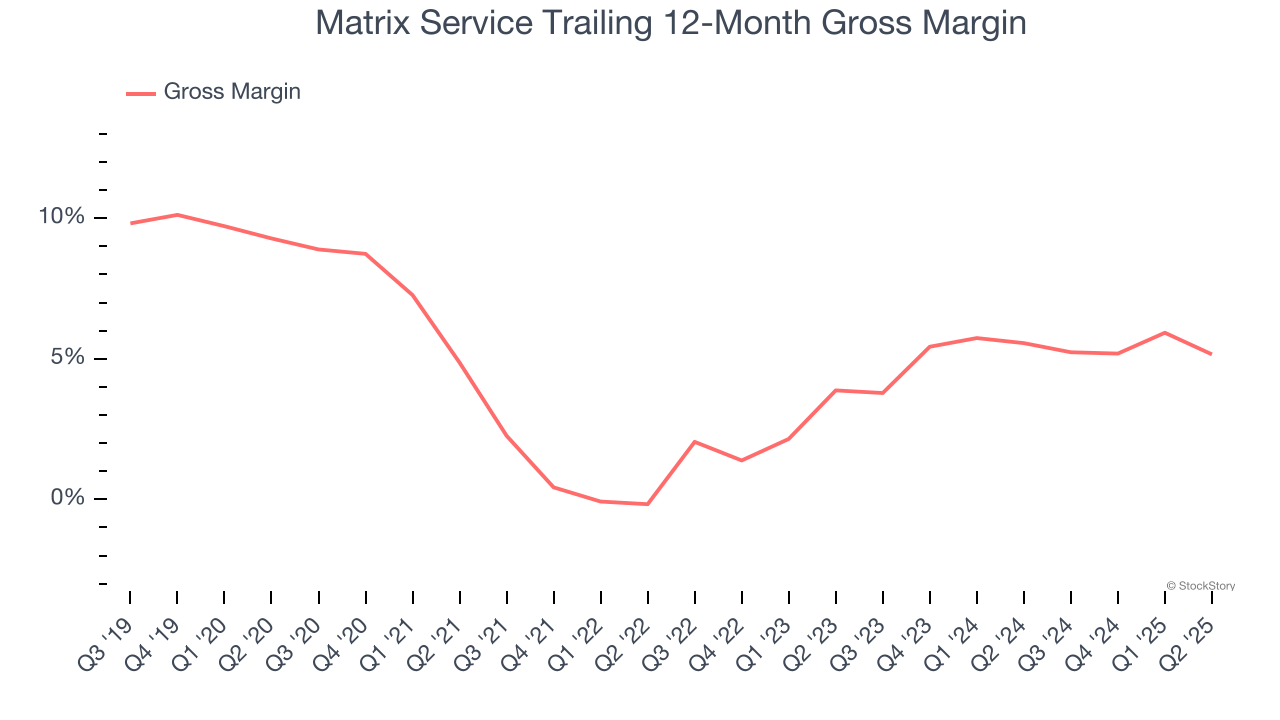
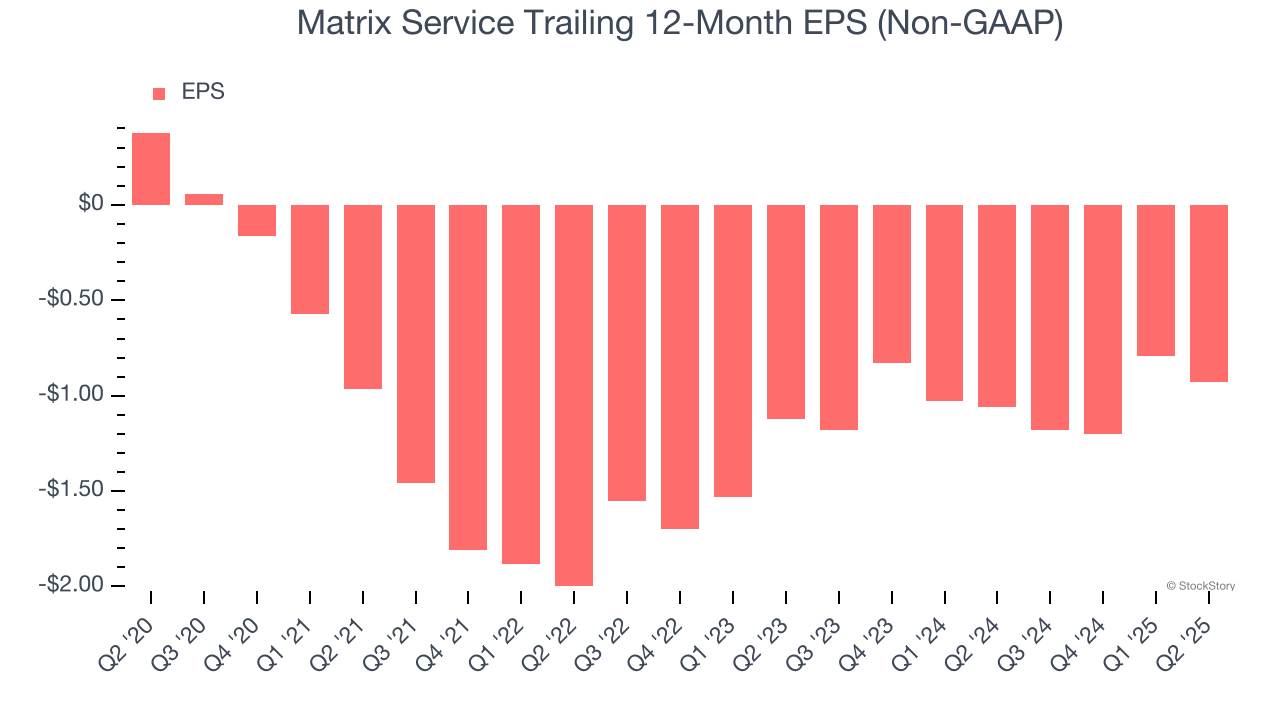
3. EPS Trending Down
Analyzing the long-term change in earnings per share (EPS) shows whether a company's incremental sales were profitable – for example, revenue could be inflated through excessive spending on advertising and promotions.
Sadly for Matrix Service, its EPS declined by 34.8% annually over the last five years, more than its revenue. This tells us the company struggled because its fixed cost base made it difficult to adjust to shrinking demand.
Final Judgment
Matrix Service falls short of our quality standards. With its shares lagging the market recently, the stock trades at 20.6× forward P/E (or $12.89 per share). This valuation is reasonable, but the company’s shaky fundamentals present too much downside risk. There are more exciting stocks to buy at the moment. We’d recommend looking at the most entrenched endpoint security platform on the market.
High-Quality Stocks for All Market Conditions
Donald Trump’s April 2025 "Liberation Day" tariffs sent markets into a tailspin, but stocks have since rebounded strongly, proving that knee-jerk reactions often create the best buying opportunities.
The smart money is already positioning for the next leg up. Don’t miss out on the recovery - check out our Top 5 Growth Stocks for this month. This is a curated list of our High Quality stocks that have generated a market-beating return of 183% over the last five years (as of March 31st 2025).
Stocks that made our list in 2020 include now familiar names such as Nvidia (+1,545% between March 2020 and March 2025) as well as under-the-radar businesses like the once-small-cap company Comfort Systems (+782% five-year return). Find your next big winner with StockStory today.
StockStory is growing and hiring equity analyst and marketing roles. Are you a 0 to 1 builder passionate about the markets and AI? See the open roles here.