Even though Crown Holdings (currently trading at $96.74 per share) has gained 7.2% over the last six months, it has lagged the S&P 500’s 18.4% return during that period. This might have investors contemplating their next move.
Is there a buying opportunity in Crown Holdings, or does it present a risk to your portfolio? Get the full stock story straight from our expert analysts, it’s free.
Why Do We Think Crown Holdings Will Underperform?
We don't have much confidence in Crown Holdings. Here are three reasons there are better opportunities than CCK and a stock we'd rather own.
1. Declining Constant Currency Revenue, Demand Takes a Hit
In addition to reported revenue, constant currency revenue is a useful data point for analyzing Industrial Packaging companies. This metric excludes currency movements, which are outside of Crown Holdings’s control and are not indicative of underlying demand.
Over the last two years, Crown Holdings’s constant currency revenue averaged 1.6% year-on-year declines. This performance was underwhelming and implies there may be increasing competition or market saturation. It also suggests Crown Holdings might have to lower prices or invest in product improvements to accelerate growth, factors that can hinder near-term profitability. 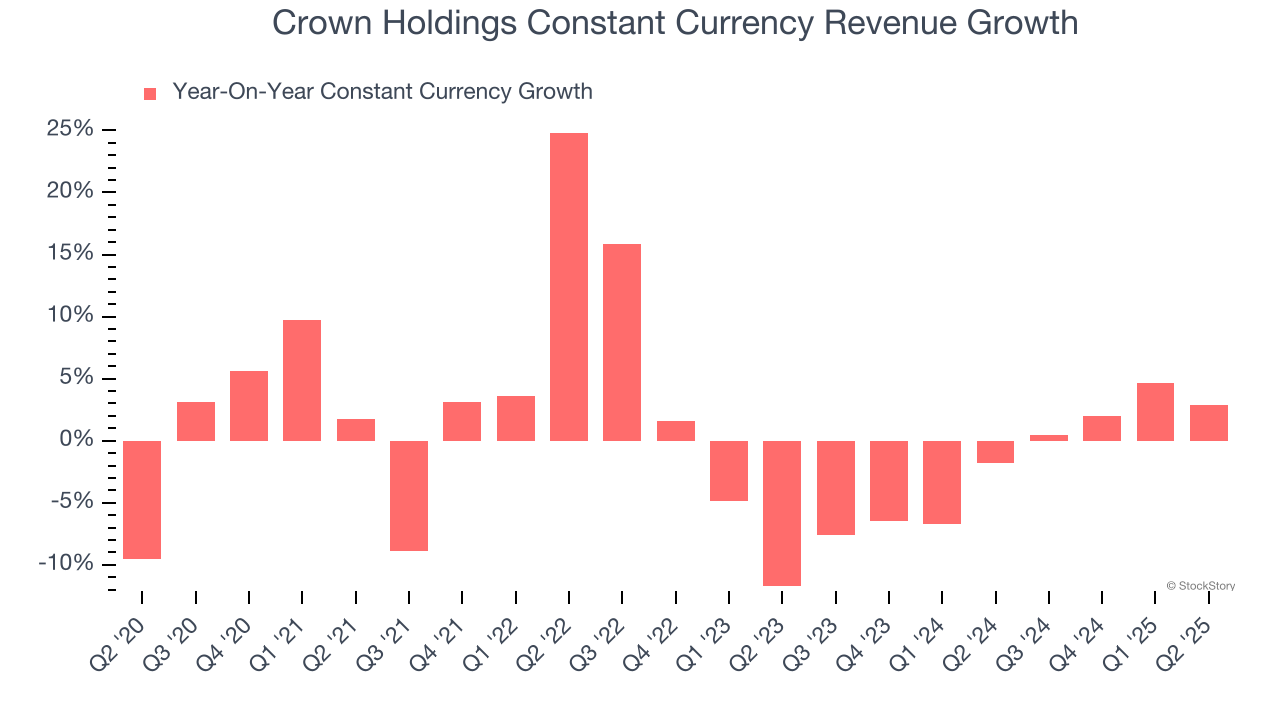
2. Projected Revenue Growth Is Slim
Forecasted revenues by Wall Street analysts signal a company’s potential. Predictions may not always be accurate, but accelerating growth typically boosts valuation multiples and stock prices while slowing growth does the opposite.
Over the next 12 months, sell-side analysts expect Crown Holdings’s revenue to rise by 2.8%. Although this projection indicates its newer products and services will spur better top-line performance, it is still below the sector average.
3. Low Gross Margin Reveals Weak Structural Profitability
Cost of sales for an industrials business is usually comprised of the direct labor, raw materials, and supplies needed to offer a product or service. These costs can be impacted by inflation and supply chain dynamics.
Crown Holdings has bad unit economics for an industrials business, signaling it operates in a competitive market. As you can see below, it averaged a 20.4% gross margin over the last five years. Said differently, Crown Holdings had to pay a chunky $79.58 to its suppliers for every $100 in revenue. 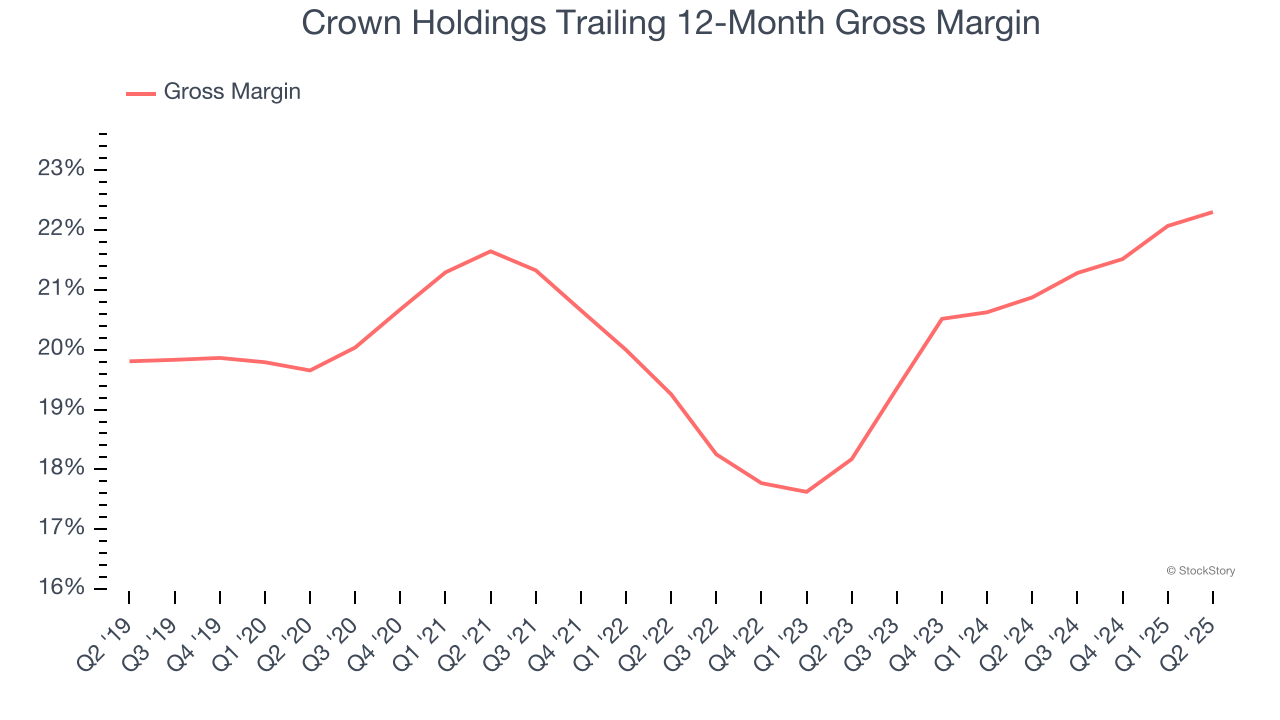
Final Judgment
Crown Holdings falls short of our quality standards. With its shares lagging the market recently, the stock trades at 13.4× forward P/E (or $96.74 per share). While this valuation is reasonable, we don’t see a big opportunity at the moment. There are better investments elsewhere. We’d suggest looking at an all-weather company that owns household favorite Taco Bell.
Stocks We Would Buy Instead of Crown Holdings
Trump’s April 2025 tariff bombshell triggered a massive market selloff, but stocks have since staged an impressive recovery, leaving those who panic sold on the sidelines.
Take advantage of the rebound by checking out our Top 5 Strong Momentum Stocks for this week. This is a curated list of our High Quality stocks that have generated a market-beating return of 183% over the last five years (as of March 31st 2025).
Stocks that made our list in 2020 include now familiar names such as Nvidia (+1,545% between March 2020 and March 2025) as well as under-the-radar businesses like the once-small-cap company Comfort Systems (+782% five-year return). Find your next big winner with StockStory today.
StockStory is growing and hiring equity analyst and marketing roles. Are you a 0 to 1 builder passionate about the markets and AI? See the open roles here.