Even though Greenbrier (currently trading at $45.27 per share) has gained 8.4% over the last six months, it has lagged the S&P 500’s 29.3% return during that period. This might have investors contemplating their next move.
Is there a buying opportunity in Greenbrier, or does it present a risk to your portfolio? Get the full stock story straight from our expert analysts, it’s free for active Edge members.
Why Is Greenbrier Not Exciting?
We're swiping left on Greenbrier for now. Here are three reasons there are better opportunities than GBX and a stock we'd rather own.
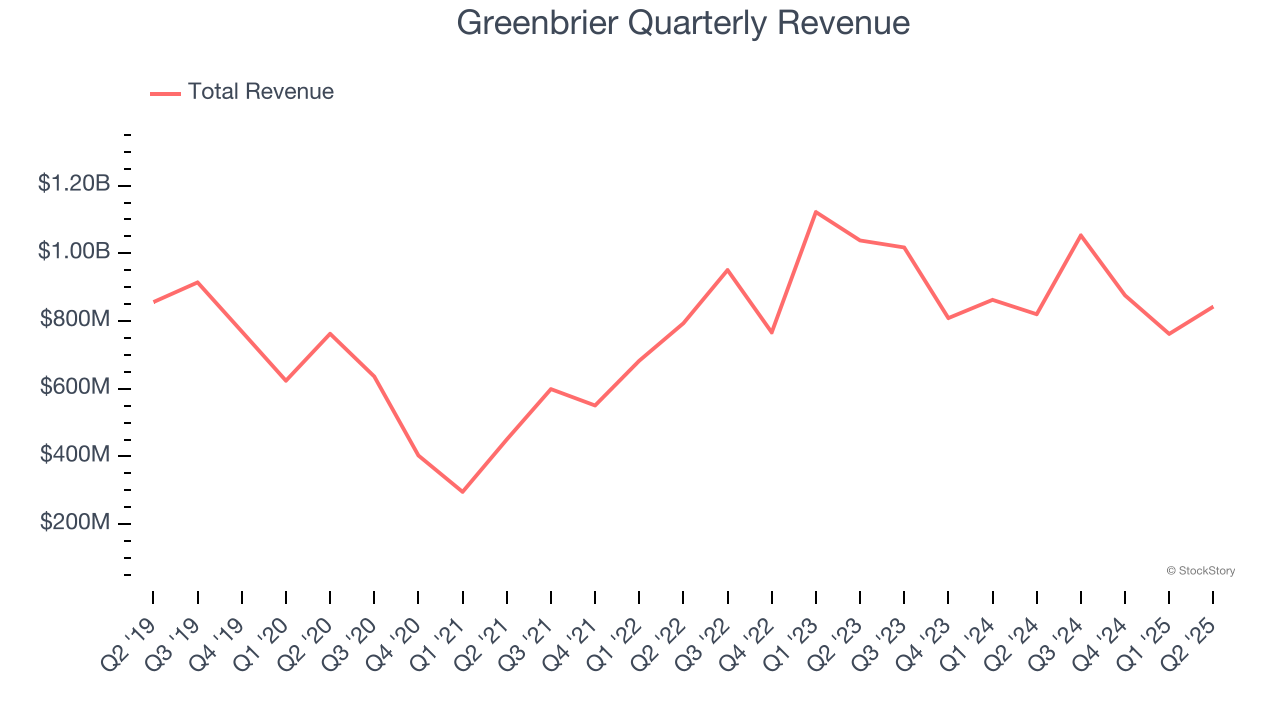
1. Long-Term Revenue Growth Disappoints
A company’s long-term sales performance can indicate its overall quality. Any business can experience short-term success, but top-performing ones enjoy sustained growth for years. Unfortunately, Greenbrier’s 2.9% annualized revenue growth over the last five years was sluggish. This fell short of our benchmarks.
2. Low Gross Margin Reveals Weak Structural Profitability
For industrials businesses, cost of sales is usually comprised of the direct labor, raw materials, and supplies needed to offer a product or service. These costs can be impacted by inflation and supply chain dynamics in the short term and a company’s purchasing power and scale over the long term.
Greenbrier has bad unit economics for an industrials business, signaling it operates in a competitive market. As you can see below, it averaged a 13.5% gross margin over the last five years. That means Greenbrier paid its suppliers a lot of money ($86.51 for every $100 in revenue) to run its business. 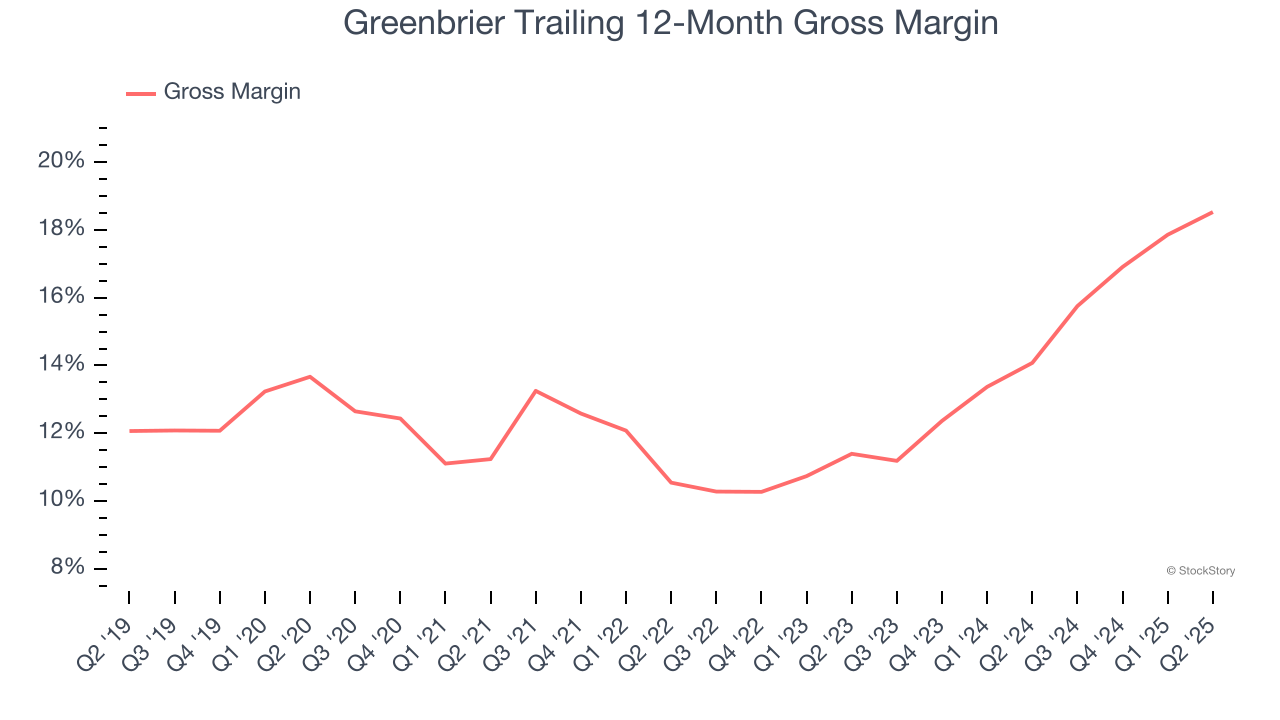
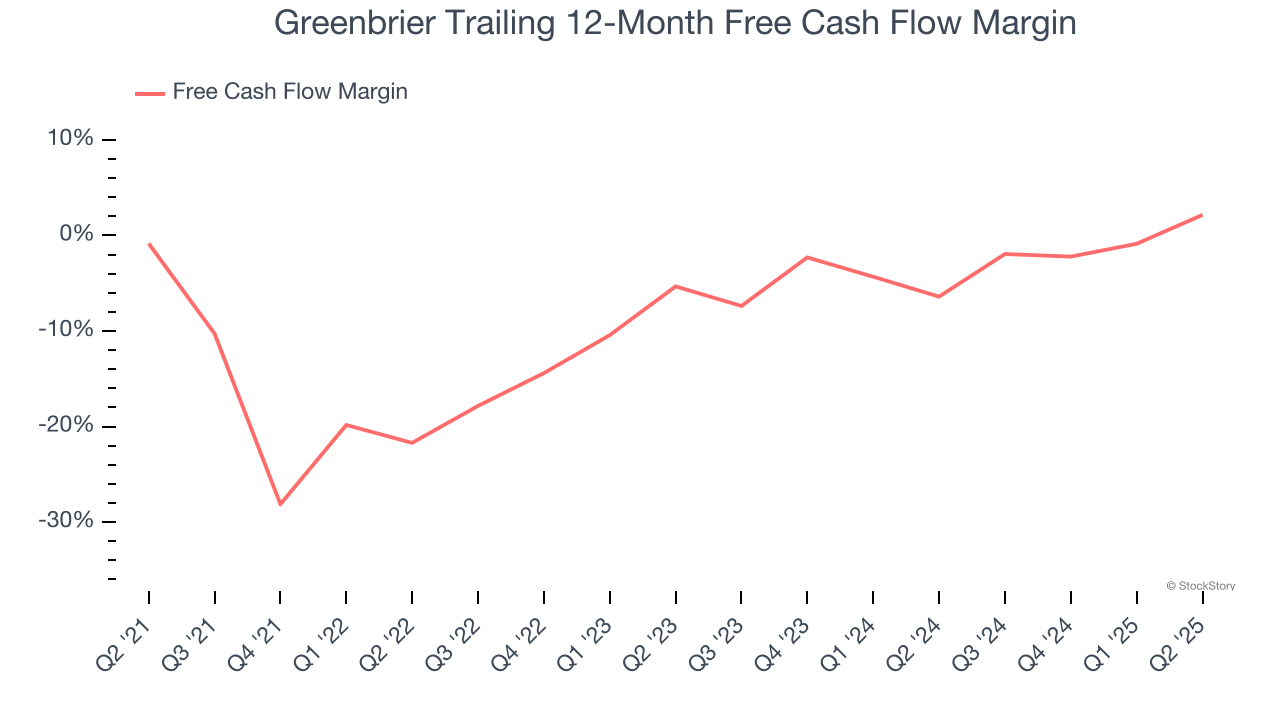
3. Cash Burn Ignites Concerns
If you’ve followed StockStory for a while, you know we emphasize free cash flow. Why, you ask? We believe that in the end, cash is king, and you can’t use accounting profits to pay the bills.
While Greenbrier posted positive free cash flow this quarter, the broader story hasn’t been so clean. Greenbrier’s demanding reinvestments have drained its resources over the last five years, putting it in a pinch and limiting its ability to return capital to investors. Its free cash flow margin averaged negative 6.1%, meaning it lit $6.13 of cash on fire for every $100 in revenue.
Final Judgment
Greenbrier isn’t a terrible business, but it isn’t one of our picks. With its shares lagging the market recently, the stock trades at 8.8× forward P/E (or $45.27 per share). While this valuation is optically cheap, the potential downside is big given its shaky fundamentals. We're pretty confident there are superior stocks to buy right now. Let us point you toward one of our top software and edge computing picks.
Stocks We Would Buy Instead of Greenbrier
When Trump unveiled his aggressive tariff plan in April 2025, markets tanked as investors feared a full-blown trade war. But those who panicked and sold missed the subsequent rebound that’s already erased most losses.
Don’t let fear keep you from great opportunities and take a look at Top 6 Stocks for this week. This is a curated list of our High Quality stocks that have generated a market-beating return of 183% over the last five years (as of March 31st 2025).
Stocks that made our list in 2020 include now familiar names such as Nvidia (+1,545% between March 2020 and March 2025) as well as under-the-radar businesses like the once-small-cap company Exlservice (+354% five-year return). Find your next big winner with StockStory today.
StockStory is growing and hiring equity analyst and marketing roles. Are you a 0 to 1 builder passionate about the markets and AI? See the open roles here.