
Commercial banking company Preferred Bank (NASDAQ: PFBC) reported Q3 CY2025 results beating Wall Street’s revenue expectations, with sales up 3.7% year on year to $74.98 million. Its GAAP profit of $2.84 per share was 10.6% above analysts’ consensus estimates.
Is now the time to buy Preferred Bank? Find out by accessing our full research report, it’s free for active Edge members.
Preferred Bank (PFBC) Q3 CY2025 Highlights:
- Net Interest Income: $71.31 million vs analyst estimates of $68.93 million (3.6% year-on-year growth, 3.4% beat)
- Net Interest Margin: 3.9% vs analyst estimates of 3.8% (8.6 basis point beat)
- Revenue: $74.98 million vs analyst estimates of $72.43 million (3.7% year-on-year growth, 3.5% beat)
- Efficiency Ratio: 28.7% vs analyst estimates of 30.2% (152.6 basis point beat)
- EPS (GAAP): $2.84 vs analyst estimates of $2.57 (10.6% beat)
- Tangible Book Value per Share: $62.81 vs analyst estimates of $62.02 (11.1% year-on-year growth, 1.3% beat)
- Market Capitalization: $1.06 billion
Li Yu, Chairman and CEO, commented, “We are pleased to report a quarterly record for diluted earnings per share of $2.84 for the third quarter of 2025. Net income for the quarter was $35.9 million.
Company Overview
Founded in 1991 with a focus on serving the Pacific Rim community in Southern California, Preferred Bank (NASDAQ: PFBC) is a commercial bank that provides banking products and services to small and mid-sized businesses, entrepreneurs, real estate developers, and high net worth individuals.
Sales Growth
Two primary revenue streams drive bank earnings. While net interest income, which is earned by charging higher rates on loans than paid on deposits, forms the foundation, fee-based services across banking, credit, wealth management, and trading operations provide additional income. Over the last five years, Preferred Bank grew its revenue at an impressive 10.2% compounded annual growth rate. Its growth beat the average banking company and shows its offerings resonate with customers, a helpful starting point for our analysis.
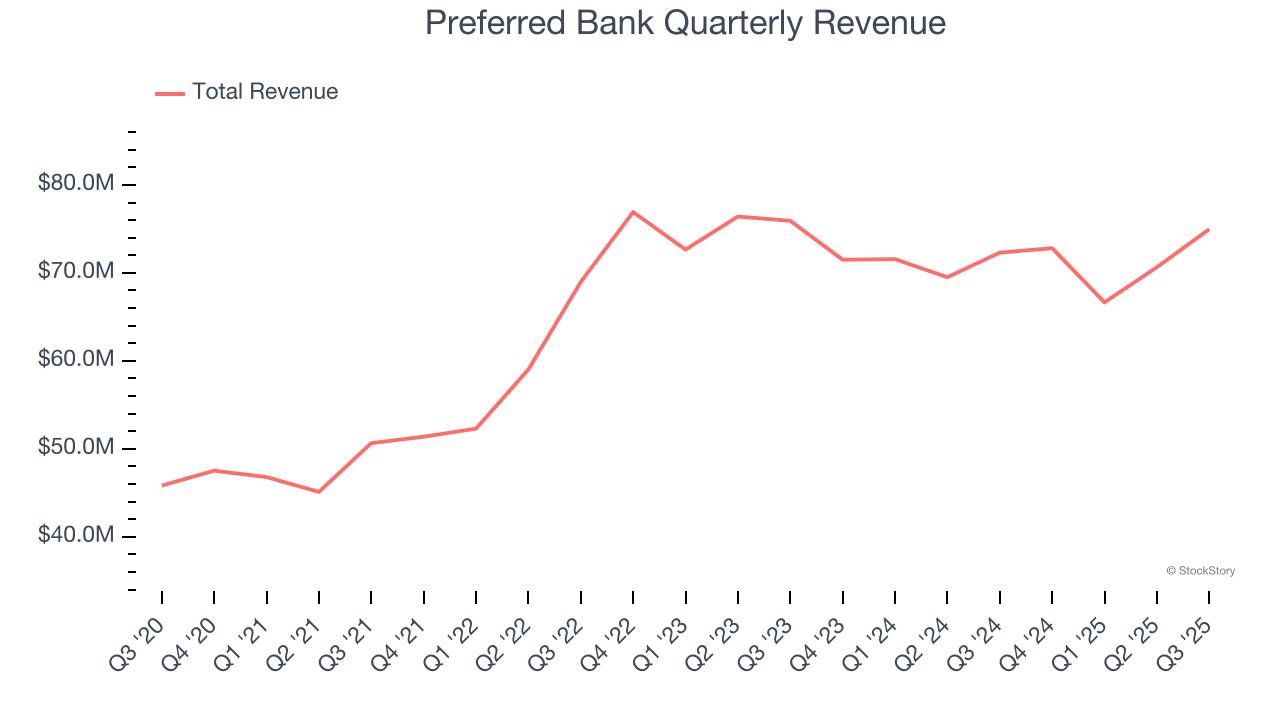
We at StockStory place the most emphasis on long-term growth, but within financials, a half-decade historical view may miss recent interest rate changes, market returns, and industry trends. Preferred Bank’s recent performance marks a sharp pivot from its five-year trend as its revenue has shown annualized declines of 2.8% over the last two years. 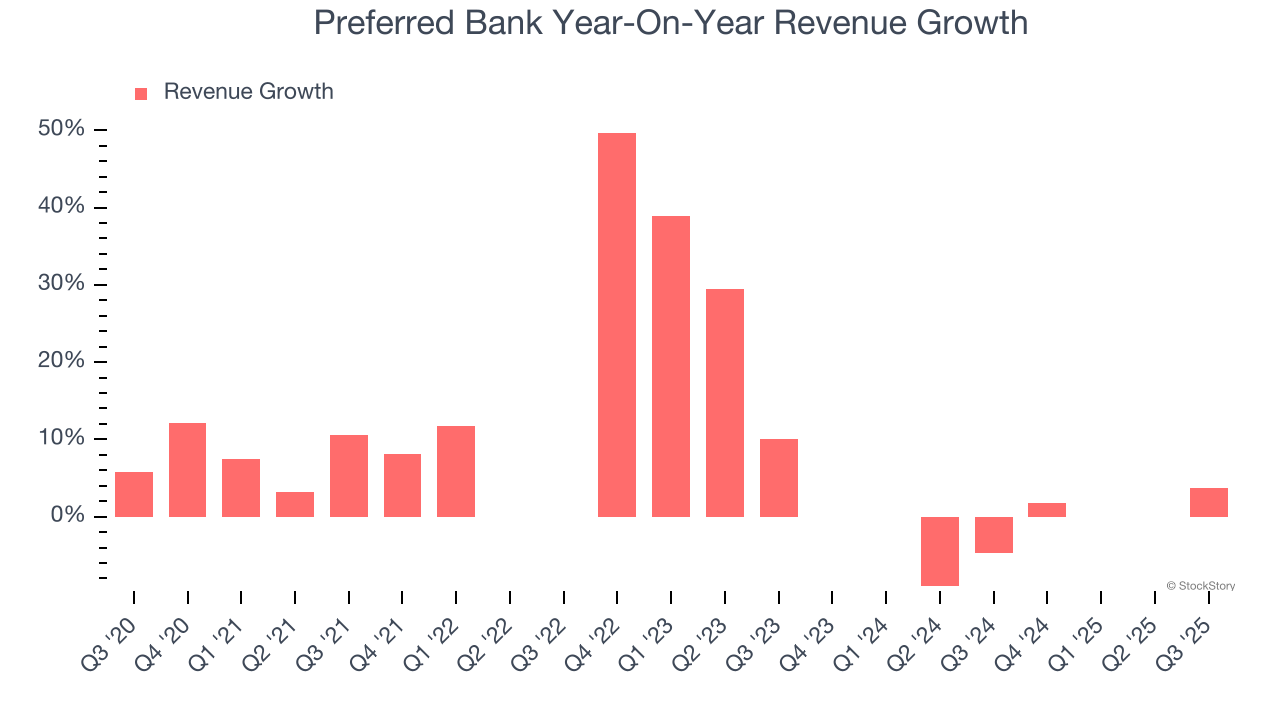 Note: Quarters not shown were determined to be outliers, impacted by outsized investment gains/losses that are not indicative of the recurring fundamentals of the business.
This quarter, Preferred Bank reported modest year-on-year revenue growth of 3.7% but beat Wall Street’s estimates by 3.5%.
Net interest income made up 96% of the company’s total revenue during the last five years, meaning Preferred Bank lives and dies by its lending activities because non-interest income barely moves the needle.
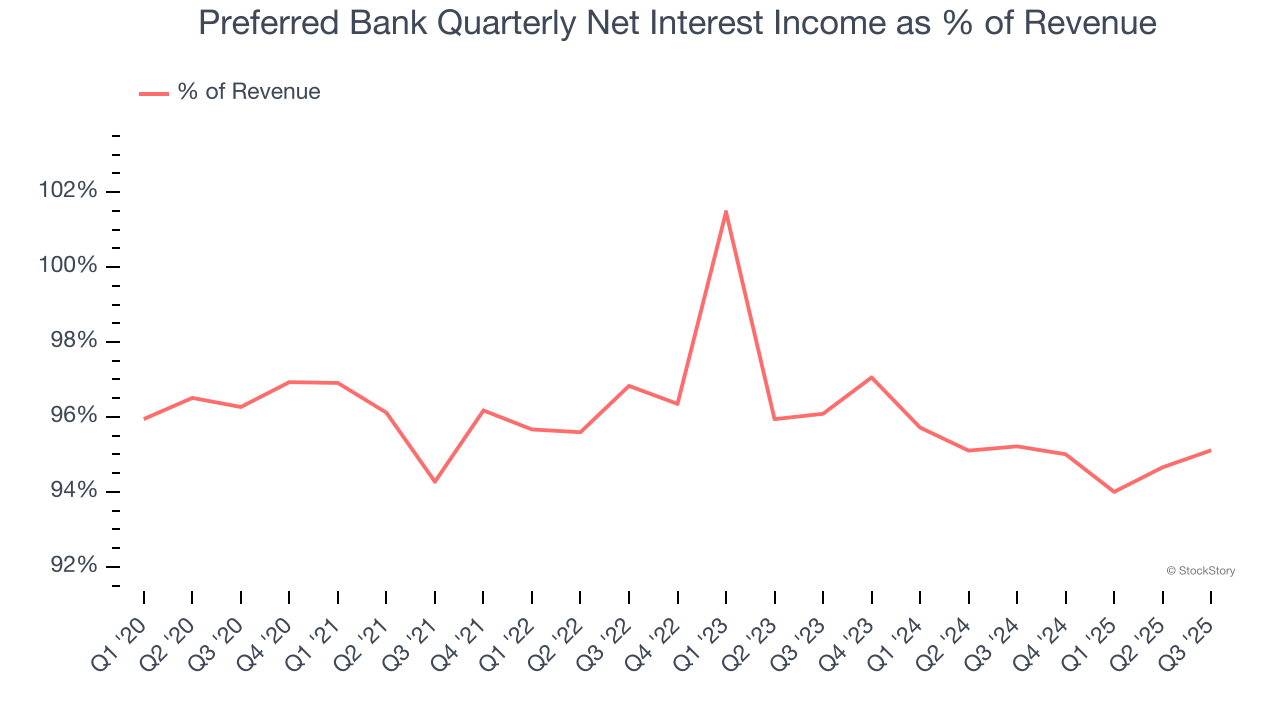
Markets consistently prioritize net interest income growth over fee-based revenue, recognizing its superior quality and recurring nature compared to the more unpredictable non-interest income streams.
Here at StockStory, we certainly understand the potential of thematic investing. Diverse winners from Microsoft (MSFT) to Alphabet (GOOG), Coca-Cola (KO) to Monster Beverage (MNST) could all have been identified as promising growth stories with a megatrend driving the growth. So, in that spirit, we’ve identified a relatively under-the-radar profitable growth stock benefiting from the rise of AI, available to you FREE via this link.
Tangible Book Value Per Share (TBVPS)
Banks are balance sheet-driven businesses because they generate earnings primarily through borrowing and lending. They’re also valued based on their balance sheet strength and ability to compound book value (another name for shareholders’ equity) over time.
This explains why tangible book value per share (TBVPS) stands as the premier banking metric. TBVPS strips away questionable intangible assets, revealing concrete per-share net worth that investors can trust. On the other hand, EPS is often distorted by mergers and flexible loan loss accounting. TBVPS provides clearer performance insights.
Preferred Bank’s TBVPS grew at an incredible 13.2% annual clip over the last five years. The last two years show a similar trajectory as TBVPS grew by 13.5% annually from $48.75 to $62.81 per share.
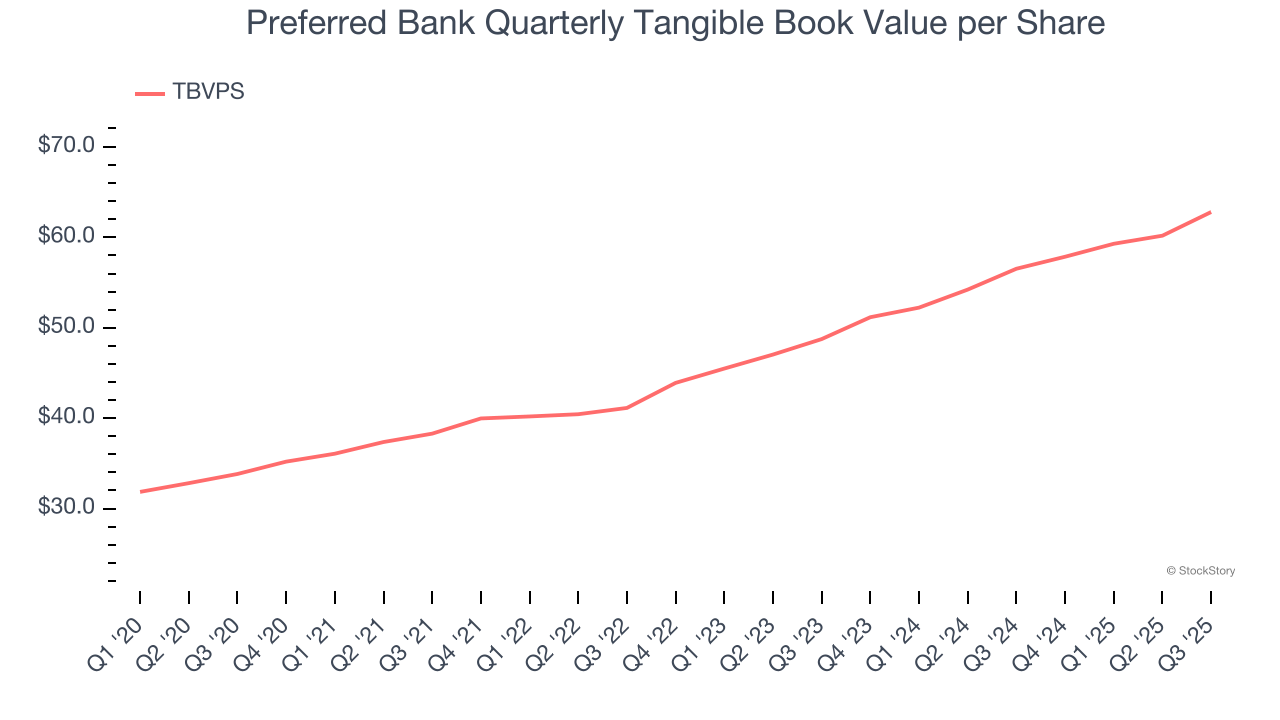
Over the next 12 months, Consensus estimates call for Preferred Bank’s TBVPS to grow by 9.6% to $68.82, solid growth rate.
Key Takeaways from Preferred Bank’s Q3 Results
We enjoyed seeing Preferred Bank beat analysts’ revenue expectations this quarter. We were also glad its net interest income outperformed Wall Street’s estimates. Zooming out, we think this quarter featured some important positives. The stock traded up 3.6% to $89.22 immediately after reporting.
Preferred Bank may have had a good quarter, but does that mean you should invest right now? The latest quarter does matter, but not nearly as much as longer-term fundamentals and valuation, when deciding if the stock is a buy. We cover that in our actionable full research report which you can read here, it’s free for active Edge members.