
Regional banking company Zions Bancorporation (NASDAQ: ZION) reported Q3 CY2025 results exceeding the market’s revenue expectations, with sales up 8.7% year on year to $861 million. Its GAAP profit of $1.48 per share was 6.1% above analysts’ consensus estimates.
Is now the time to buy Zions Bancorporation? Find out by accessing our full research report, it’s free for active Edge members.
Zions Bancorporation (ZION) Q3 CY2025 Highlights:
- Net Interest Income: $672 million vs analyst estimates of $666 million (8.4% year-on-year growth, 0.9% beat)
- Net Interest Margin: 3.3% vs analyst estimates of 3.2% (6.9 basis point beat)
- Revenue: $861 million vs analyst estimates of $838.2 million (8.7% year-on-year growth, 2.7% beat)
- Efficiency Ratio: 59.6% vs analyst estimates of 62.7% (309.9 basis point beat)
- EPS (GAAP): $1.48 vs analyst estimates of $1.40 (6.1% beat)
- Tangible Book Value per Share: $38.64 vs analyst estimates of $38.14 (16.7% year-on-year growth, 1.3% beat)
- Market Capitalization: $7.67 billion
Company Overview
Founded in 1873 during Utah's pioneer era and named after Mount Zion in the Bible, Zions Bancorporation (NASDAQ: ZION) operates seven regional banks across the Western United States, providing commercial, retail, and wealth management services to over a million customers.
Sales Growth
Two primary revenue streams drive bank earnings. While net interest income, which is earned by charging higher rates on loans than paid on deposits, forms the foundation, fee-based services across banking, credit, wealth management, and trading operations provide additional income. Regrettably, Zions Bancorporation’s revenue grew at a mediocre 3.2% compounded annual growth rate over the last five years. This wasn’t a great result compared to the rest of the banking sector, but there are still things to like about Zions Bancorporation.
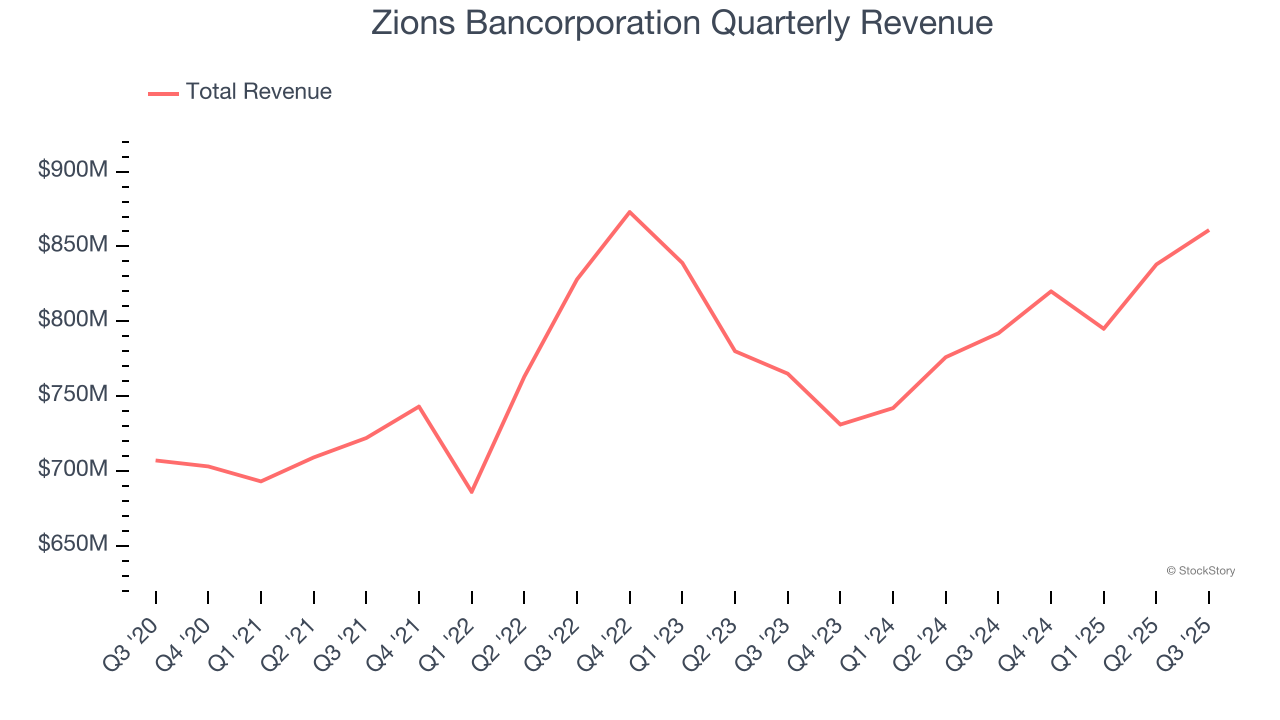
Long-term growth is the most important, but within financials, a half-decade historical view may miss recent interest rate changes and market returns. Zions Bancorporation’s recent performance shows its demand has slowed as its revenue was flat over the last two years. 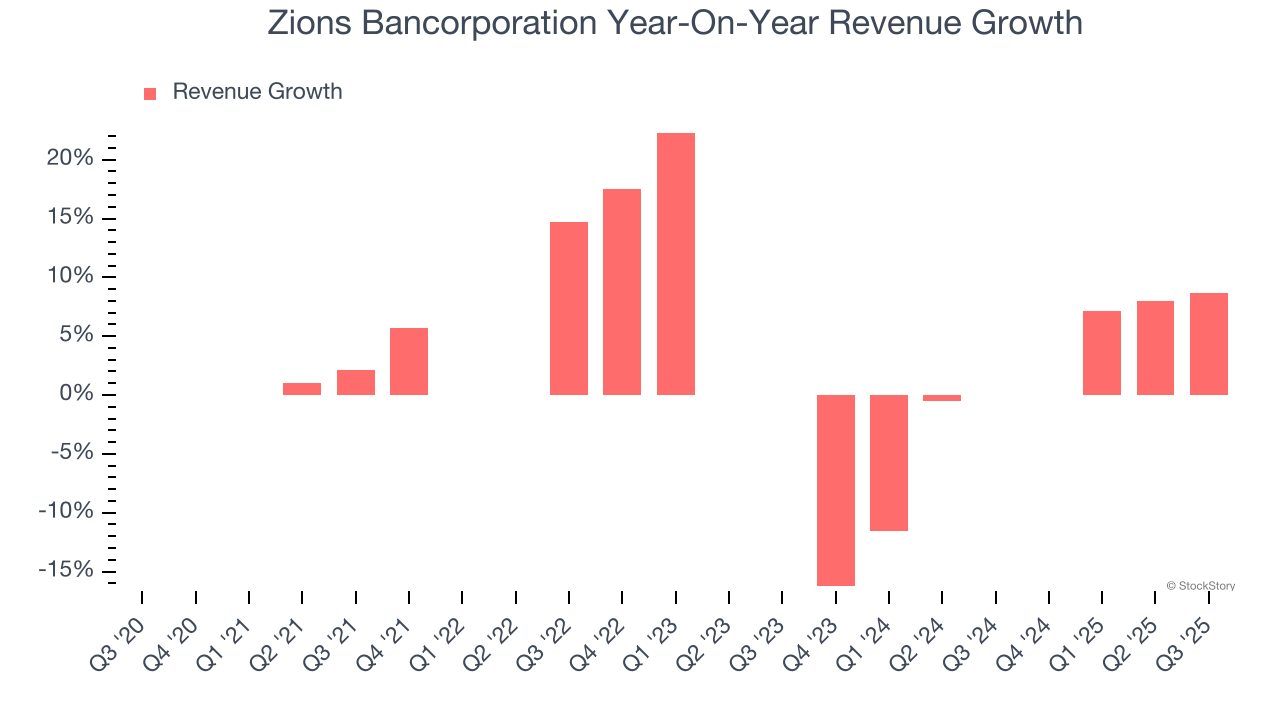 Note: Quarters not shown were determined to be outliers, impacted by outsized investment gains/losses that are not indicative of the recurring fundamentals of the business.
This quarter, Zions Bancorporation reported year-on-year revenue growth of 8.7%, and its $861 million of revenue exceeded Wall Street’s estimates by 2.7%.
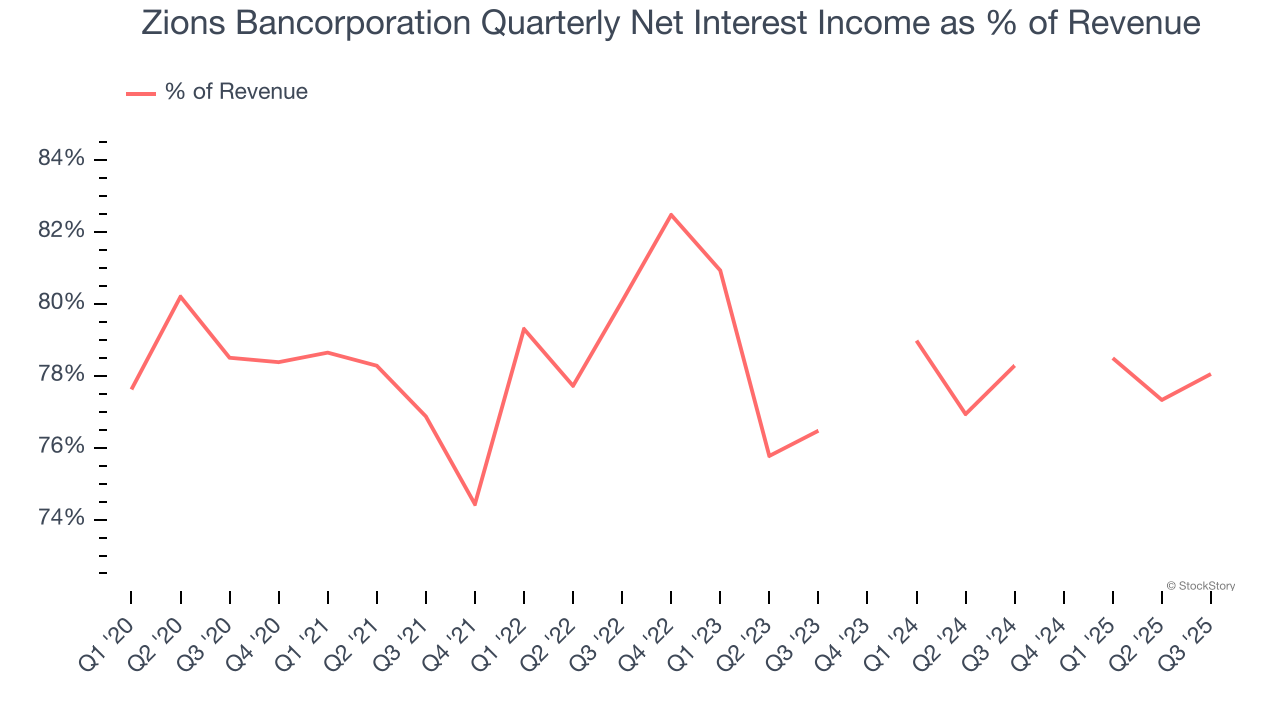
Since the company recorded losses on certain securities, it generated more net interest income than revenue during the last five years, meaning Zions Bancorporation lives and dies by its lending activities because non-interest income barely moves the needle.
 Note: Quarters not shown were determined to be outliers, impacted by outsized investment gains/losses that are not indicative of the recurring fundamentals of the business.
Our experience and research show the market cares primarily about a bank’s net interest income growth as non-interest income is considered a lower-quality and non-recurring revenue source.
Software is eating the world and there is virtually no industry left that has been untouched by it. That drives increasing demand for tools helping software developers do their jobs, whether it be monitoring critical cloud infrastructure, integrating audio and video functionality, or ensuring smooth content streaming. Click here to access a free report on our 3 favorite stocks to play this generational megatrend.
Tangible Book Value Per Share (TBVPS)
The balance sheet drives banking profitability since earnings flow from the spread between borrowing and lending rates. As such, valuations for these companies concentrate on capital strength and sustainable equity accumulation potential.
This is why we consider tangible book value per share (TBVPS) the most important metric to track for banks. TBVPS represents the real, liquid net worth per share of a bank, excluding intangible assets that have debatable value upon liquidation. Other (and more commonly known) per-share metrics like EPS can sometimes be murky due to M&A or accounting rules allowing for loan losses to be spread out.
Zions Bancorporation’s TBVPS was flat over the last five years. However, TBVPS growth has accelerated recently, growing by 22.5% annually over the last two years from $25.75 to $38.64 per share.
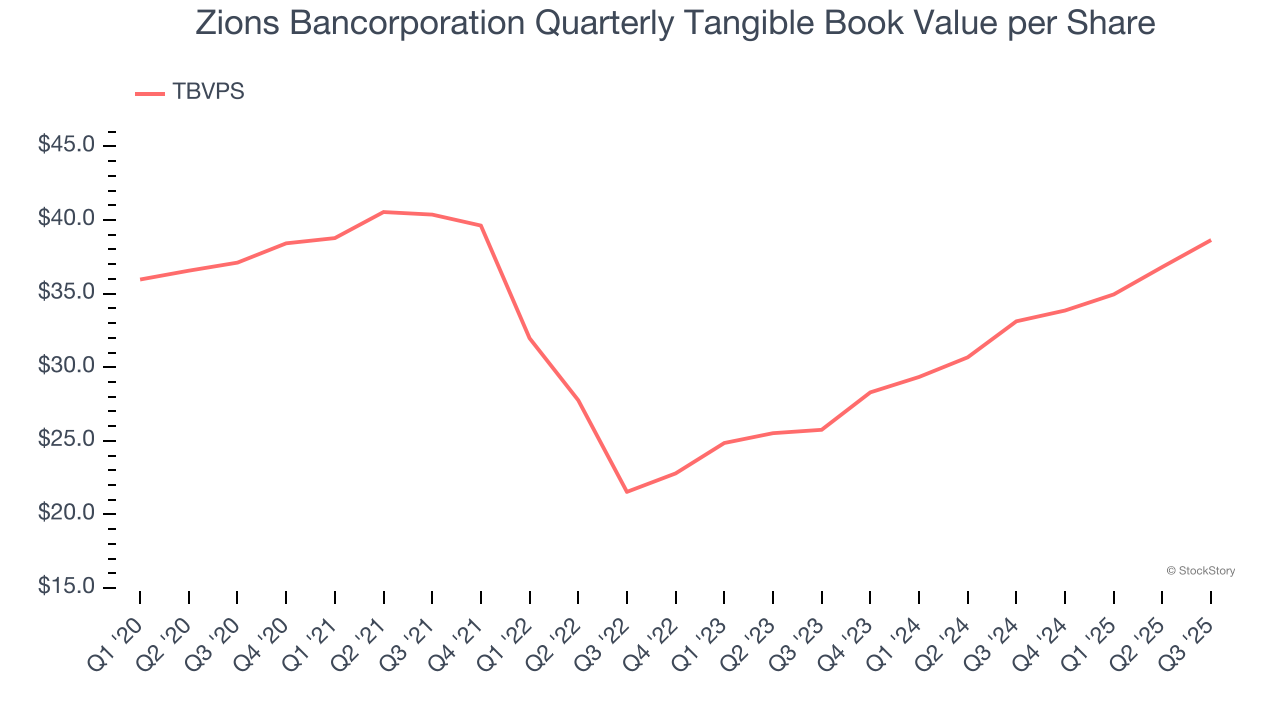
Over the next 12 months, Consensus estimates call for Zions Bancorporation’s TBVPS to grow by 12.3% to $43.37, top-notch growth rate.
Key Takeaways from Zions Bancorporation’s Q3 Results
We enjoyed seeing Zions Bancorporation beat analysts’ revenue expectations this quarter. We were also happy its tangible book value per share narrowly outperformed Wall Street’s estimates. Overall, this print had some key positives. The stock traded up 2.1% to $53.11 immediately after reporting.
Zions Bancorporation had an encouraging quarter, but one earnings result doesn’t necessarily make the stock a buy. Let’s see if this is a good investment. The latest quarter does matter, but not nearly as much as longer-term fundamentals and valuation, when deciding if the stock is a buy. We cover that in our actionable full research report which you can read here, it’s free for active Edge members.


