What a time it’s been for Diebold Nixdorf. In the past six months alone, the company’s stock price has increased by a massive 41.4%, reaching $57.41 per share. This run-up might have investors contemplating their next move.
Is now the time to buy Diebold Nixdorf, or should you be careful about including it in your portfolio? Check out our in-depth research report to see what our analysts have to say, it’s free for active Edge members.
Why Is Diebold Nixdorf Not Exciting?
We’re happy investors have made money, but we don't have much confidence in Diebold Nixdorf. Here are three reasons you should be careful with DBD and a stock we'd rather own.
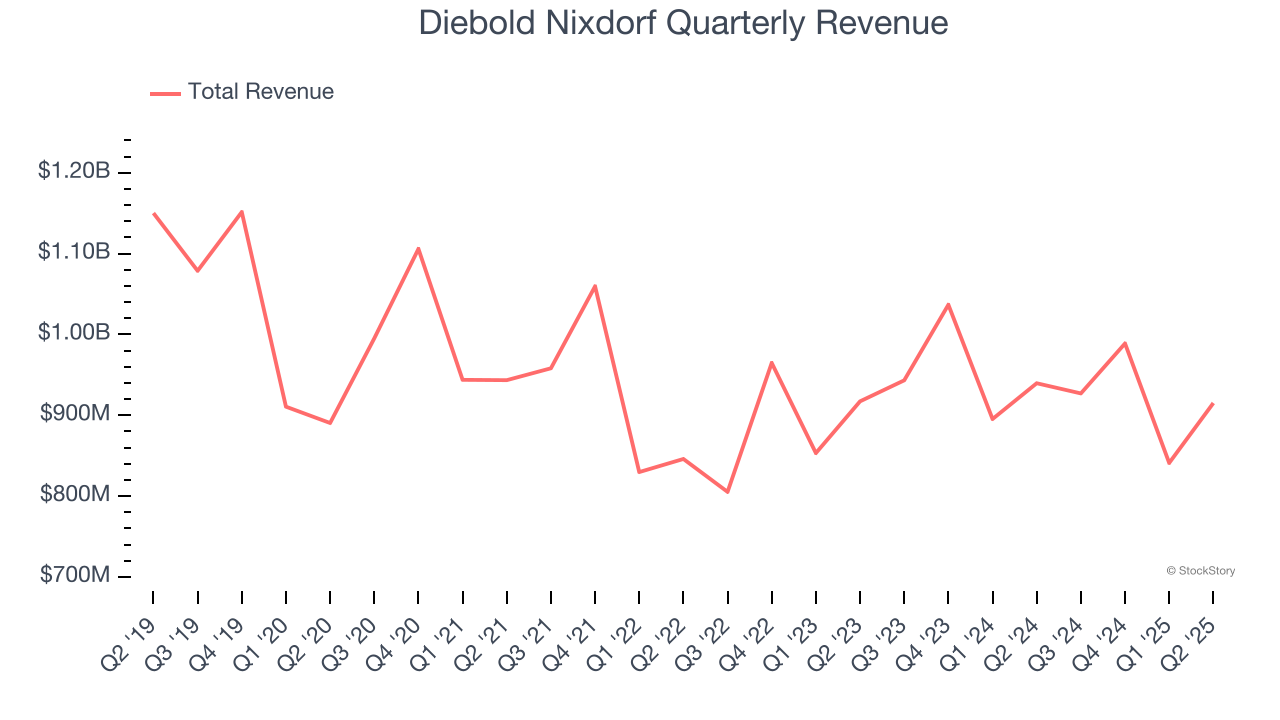
1. Revenue Spiraling Downwards
A company’s long-term sales performance can indicate its overall quality. Any business can experience short-term success, but top-performing ones enjoy sustained growth for years. Diebold Nixdorf’s demand was weak over the last five years as its sales fell at a 1.8% annual rate. This was below our standards and is a sign of lacking business quality.
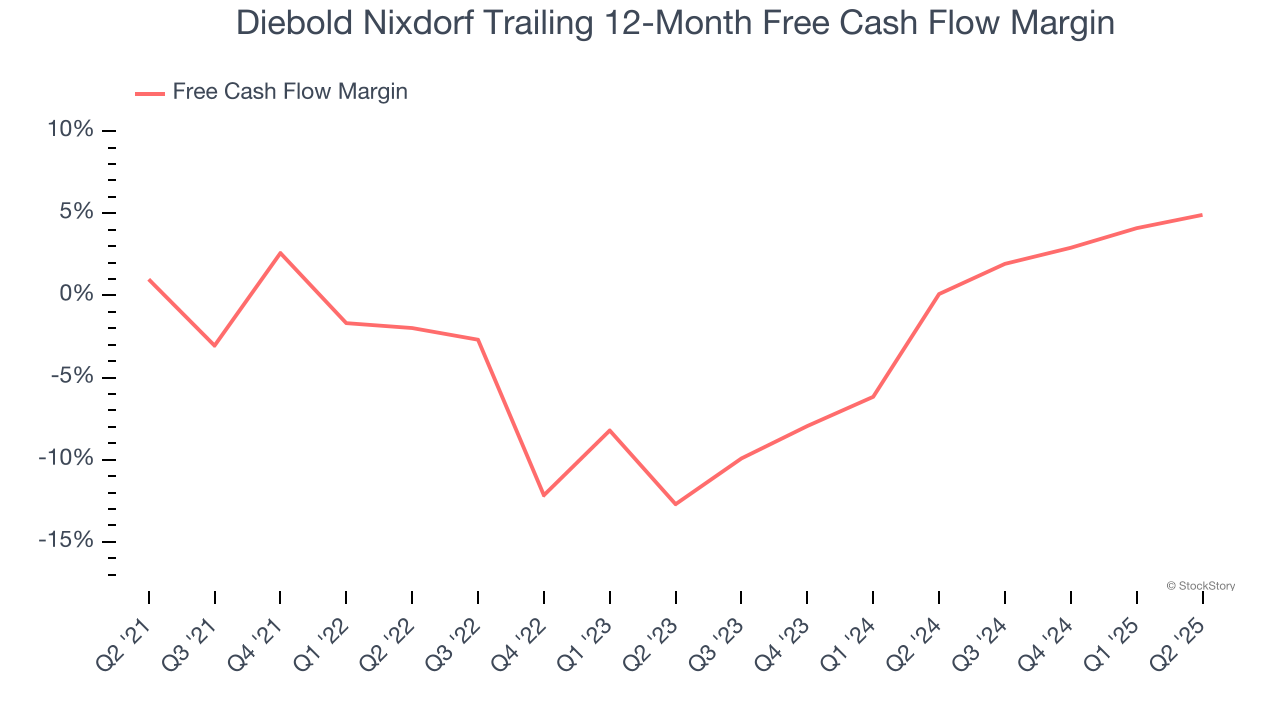
2. Cash Burn Ignites Concerns
If you’ve followed StockStory for a while, you know we emphasize free cash flow. Why, you ask? We believe that in the end, cash is king, and you can’t use accounting profits to pay the bills.
While Diebold Nixdorf posted positive free cash flow this quarter, the broader story hasn’t been so clean. Diebold Nixdorf’s demanding reinvestments have drained its resources over the last five years, putting it in a pinch and limiting its ability to return capital to investors. Its free cash flow margin averaged negative 1.6%, meaning it lit $1.61 of cash on fire for every $100 in revenue.
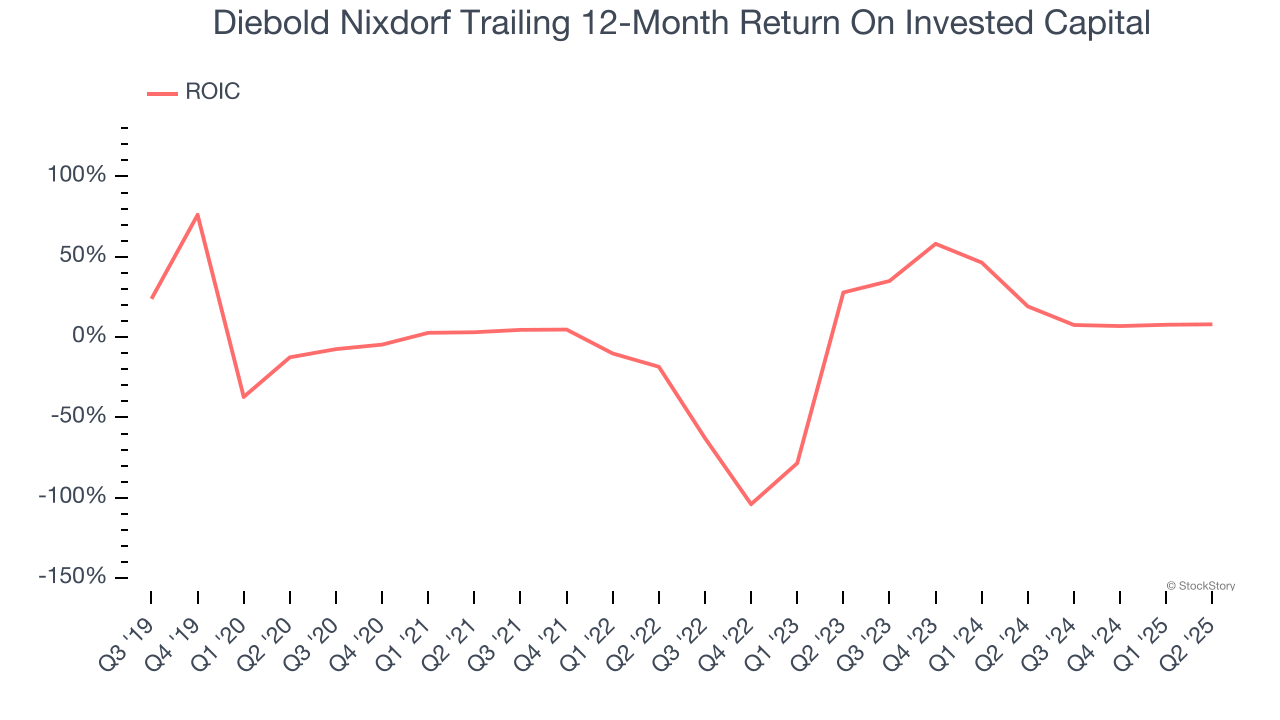
3. Previous Growth Initiatives Haven’t Impressed
Growth gives us insight into a company’s long-term potential, but how capital-efficient was that growth? Enter ROIC, a metric showing how much operating profit a company generates relative to the money it has raised (debt and equity).
Diebold Nixdorf historically did a mediocre job investing in profitable growth initiatives. Its five-year average ROIC was 3%, lower than the typical cost of capital (how much it costs to raise money) for business services companies.
Final Judgment
Diebold Nixdorf isn’t a terrible business, but it isn’t one of our picks. After the recent surge, the stock trades at 13.5× forward P/E (or $57.41 per share). While this valuation is fair, the upside isn’t great compared to the potential downside. We're pretty confident there are superior stocks to buy right now. We’d recommend looking at our favorite semiconductor picks and shovels play.
Stocks We Would Buy Instead of Diebold Nixdorf
Trump’s April 2025 tariff bombshell triggered a massive market selloff, but stocks have since staged an impressive recovery, leaving those who panic sold on the sidelines.
Take advantage of the rebound by checking out our Top 5 Strong Momentum Stocks for this week. This is a curated list of our High Quality stocks that have generated a market-beating return of 183% over the last five years (as of March 31st 2025).
Stocks that made our list in 2020 include now familiar names such as Nvidia (+1,545% between March 2020 and March 2025) as well as under-the-radar businesses like the once-small-cap company Exlservice (+354% five-year return). Find your next big winner with StockStory today.
StockStory is growing and hiring equity analyst and marketing roles. Are you a 0 to 1 builder passionate about the markets and AI? See the open roles here.