
TransDigm has been treading water for the past six months, holding steady at $1,302. The stock also fell short of the S&P 500’s 30.6% gain during that period.
Does this present a buying opportunity for TDG? Or is its underperformance reflective of its story and business quality? Find out in our full research report, it’s free for active Edge members.
Why Are We Positive On TransDigm?
Supplying parts for nearly all aircraft currently in service, TransDigm (NYSE: TDG) develops and manufactures components and systems for military and commercial aviation.
1. Core Business Firing on All Cylinders
We can better understand Aerospace companies by analyzing their organic revenue. This metric gives visibility into TransDigm’s core business because it excludes one-time events such as mergers, acquisitions, and divestitures along with foreign currency fluctuations - non-fundamental factors that can manipulate the income statement.
Over the last two years, TransDigm’s organic revenue averaged 13% year-on-year growth. This performance was impressive and shows it can expand quickly without relying on expensive (and risky) acquisitions. 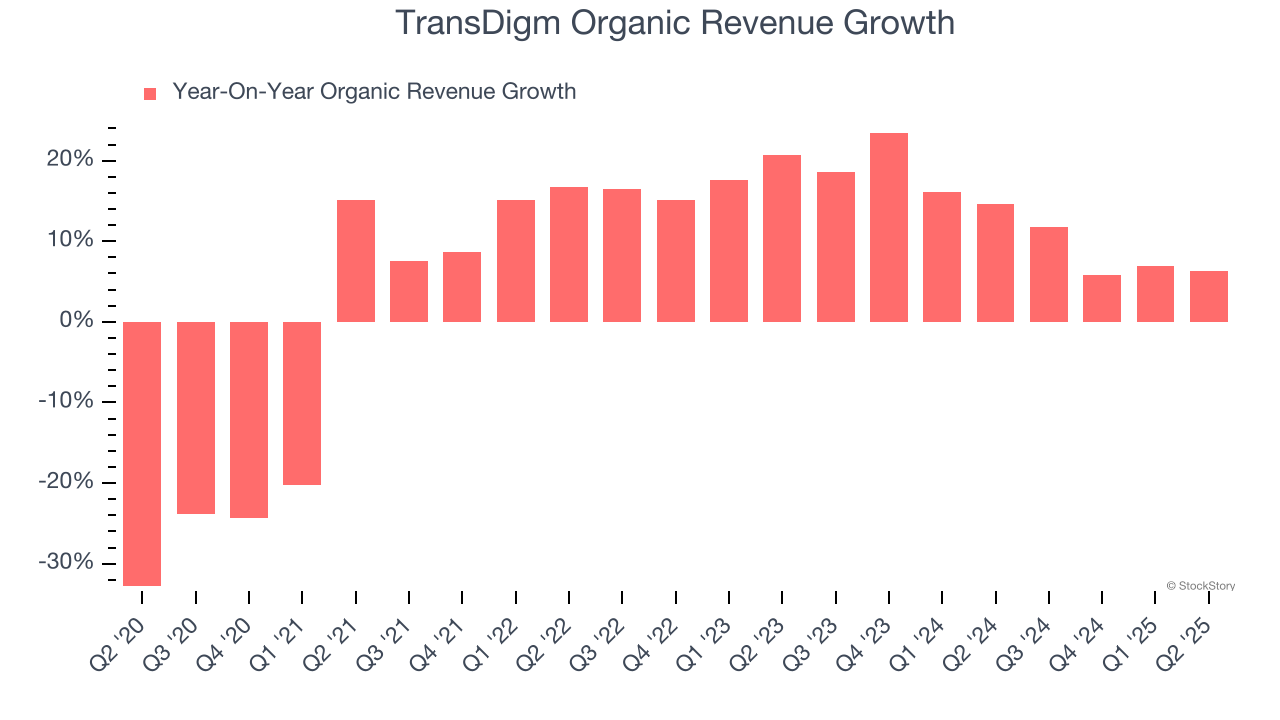
2. Outstanding Long-Term EPS Growth
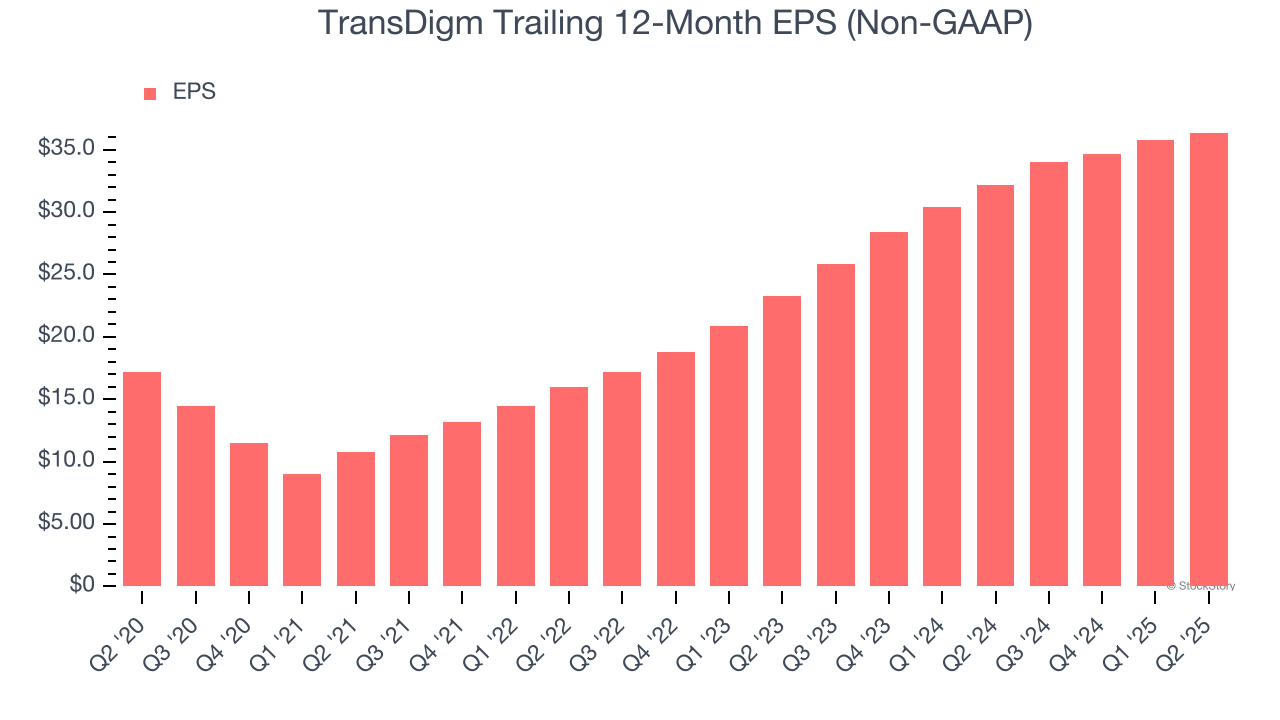
We track the long-term change in earnings per share (EPS) because it highlights whether a company’s growth is profitable.
TransDigm’s EPS grew at a spectacular 16.2% compounded annual growth rate over the last five years, higher than its 9.4% annualized revenue growth. This tells us the company became more profitable on a per-share basis as it expanded.
3. Excellent Free Cash Flow Margin Boosts Reinvestment Potential
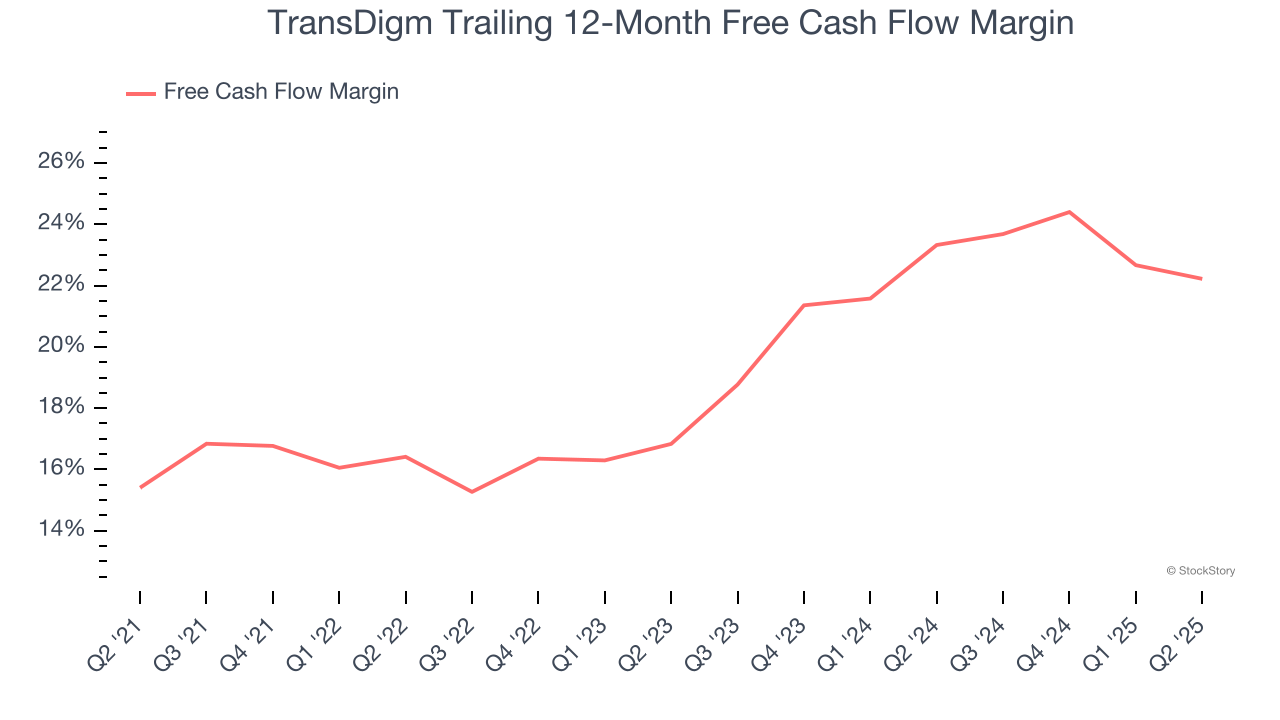
If you’ve followed StockStory for a while, you know we emphasize free cash flow. Why, you ask? We believe that in the end, cash is king, and you can’t use accounting profits to pay the bills.
TransDigm has shown terrific cash profitability, putting it in an advantageous position to invest in new products, return capital to investors, and consolidate the market during industry downturns. The company’s free cash flow margin was among the best in the industrials sector, averaging 19.5% over the last five years.
Final Judgment
These are just a few reasons why TransDigm ranks near the top of our list. With its shares trailing the market in recent months, the stock trades at 33.4× forward P/E (or $1,302 per share). Is now a good time to buy? See for yourself in our full research report, it’s free for active Edge members.
Stocks We Like Even More Than TransDigm
Donald Trump’s April 2025 "Liberation Day" tariffs sent markets into a tailspin, but stocks have since rebounded strongly, proving that knee-jerk reactions often create the best buying opportunities.
The smart money is already positioning for the next leg up. Don’t miss out on the recovery - check out our Top 6 Stocks for this week. This is a curated list of our High Quality stocks that have generated a market-beating return of 183% over the last five years (as of March 31st 2025).
Stocks that made our list in 2020 include now familiar names such as Nvidia (+1,545% between March 2020 and March 2025) as well as under-the-radar businesses like the once-small-cap company Comfort Systems (+782% five-year return). Find your next big winner with StockStory today.
StockStory is growing and hiring equity analyst and marketing roles. Are you a 0 to 1 builder passionate about the markets and AI? See the open roles here.


