
Waste management company Waste Connections (NYSE: WCN) met Wall Street’s revenue expectations in Q3 CY2025, with sales up 5.1% year on year to $2.46 billion. Its non-GAAP profit of $1.44 per share was 4.3% above analysts’ consensus estimates.
Is now the time to buy Waste Connections? Find out by accessing our full research report, it’s free for active Edge members.
Waste Connections (WCN) Q3 CY2025 Highlights:
- Revenue: $2.46 billion vs analyst estimates of $2.45 billion (5.1% year-on-year growth, in line)
- Adjusted EPS: $1.44 vs analyst estimates of $1.38 (4.3% beat)
- All full-year financial guidance was maintained from what was previously provided
- Operating Margin: 17.9%, down from 20.3% in the same quarter last year
- Free Cash Flow Margin: 15.5%, up from 12.2% in the same quarter last year
- Market Capitalization: $44.74 billion
"Superior execution drove better than expected financial results in the third quarter, bolstered by continued improvement in operating trends. Another quarterly step down in employee turnover and new record low safety incident rates, together with strong pricing retention, provided for underlying solid waste margin expansion of approximately 80 basis points in the period," said Ronald J. Mittelstaedt, President and Chief Executive Officer.
Company Overview
Operating a network of municipal solid waste landfills in the U.S. and Canada, Waste Connections (NYSE: WCN) is North America's third-largest waste management company providing collection, disposal, and recycling services.
Revenue Growth
Examining a company’s long-term performance can provide clues about its quality. Any business can put up a good quarter or two, but many enduring ones grow for years. Luckily, Waste Connections’s sales grew at an impressive 11.6% compounded annual growth rate over the last five years. Its growth beat the average industrials company and shows its offerings resonate with customers.
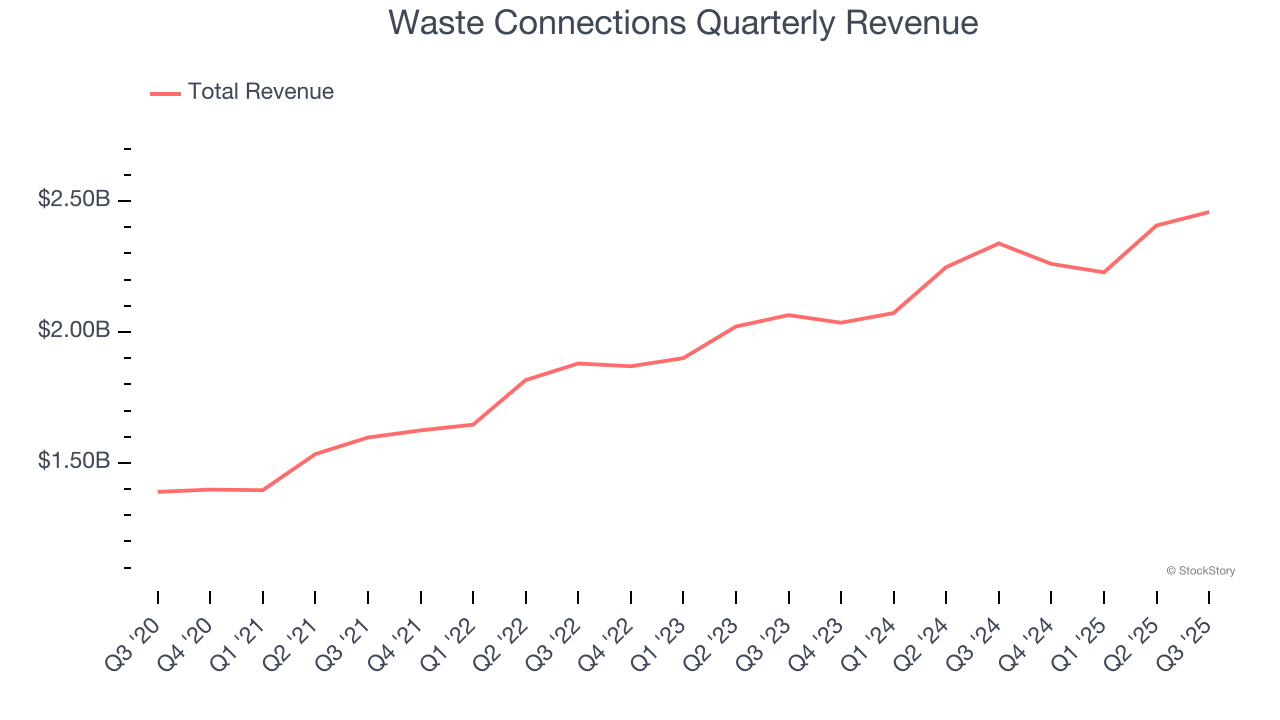
We at StockStory place the most emphasis on long-term growth, but within industrials, a half-decade historical view may miss cycles, industry trends, or a company capitalizing on catalysts such as a new contract win or a successful product line. Waste Connections’s annualized revenue growth of 9.1% over the last two years is below its five-year trend, but we still think the results suggest healthy demand. 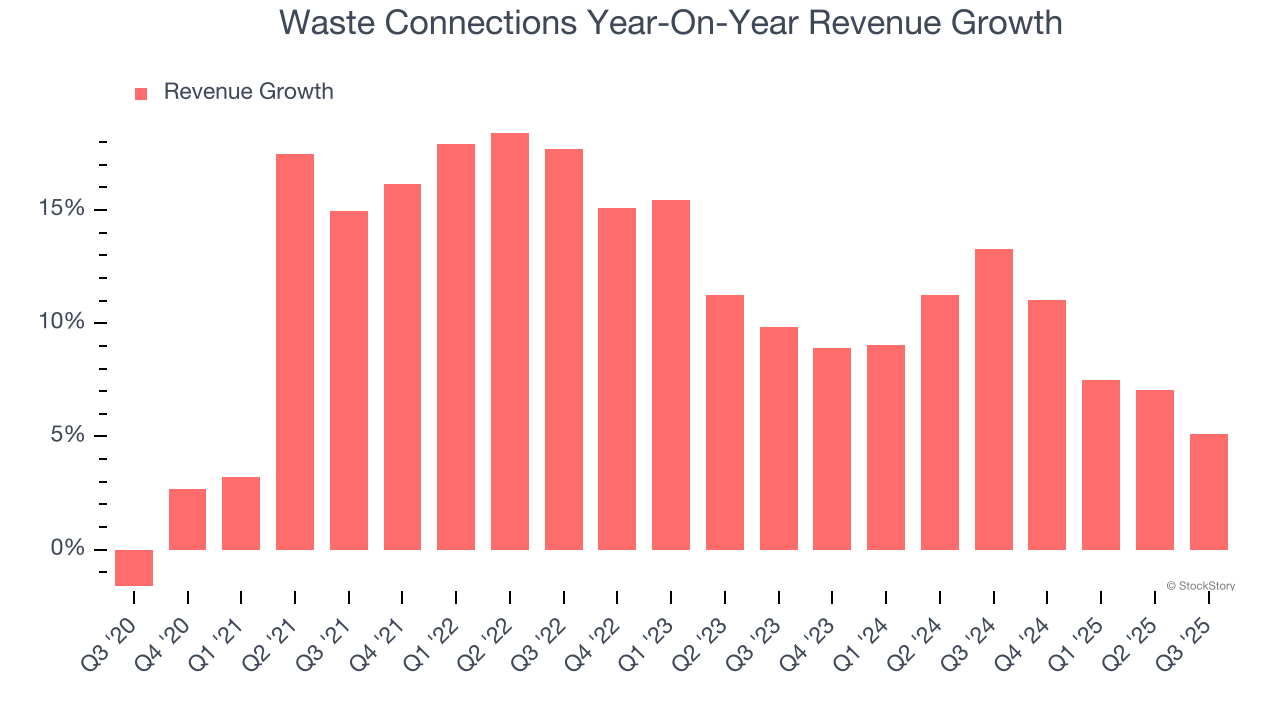
This quarter, Waste Connections grew its revenue by 5.1% year on year, and its $2.46 billion of revenue was in line with Wall Street’s estimates.
Looking ahead, sell-side analysts expect revenue to grow 5.7% over the next 12 months, a deceleration versus the last two years. This projection doesn't excite us and suggests its products and services will see some demand headwinds.
Software is eating the world and there is virtually no industry left that has been untouched by it. That drives increasing demand for tools helping software developers do their jobs, whether it be monitoring critical cloud infrastructure, integrating audio and video functionality, or ensuring smooth content streaming. Click here to access a free report on our 3 favorite stocks to play this generational megatrend.
Operating Margin
Waste Connections has been a well-oiled machine over the last five years. It demonstrated elite profitability for an industrials business, boasting an average operating margin of 15.7%. This result isn’t surprising as its high gross margin gives it a favorable starting point.
Analyzing the trend in its profitability, Waste Connections’s operating margin decreased by 5 percentage points over the last five years. This raises questions about the company’s expense base because its revenue growth should have given it leverage on its fixed costs, resulting in better economies of scale and profitability.
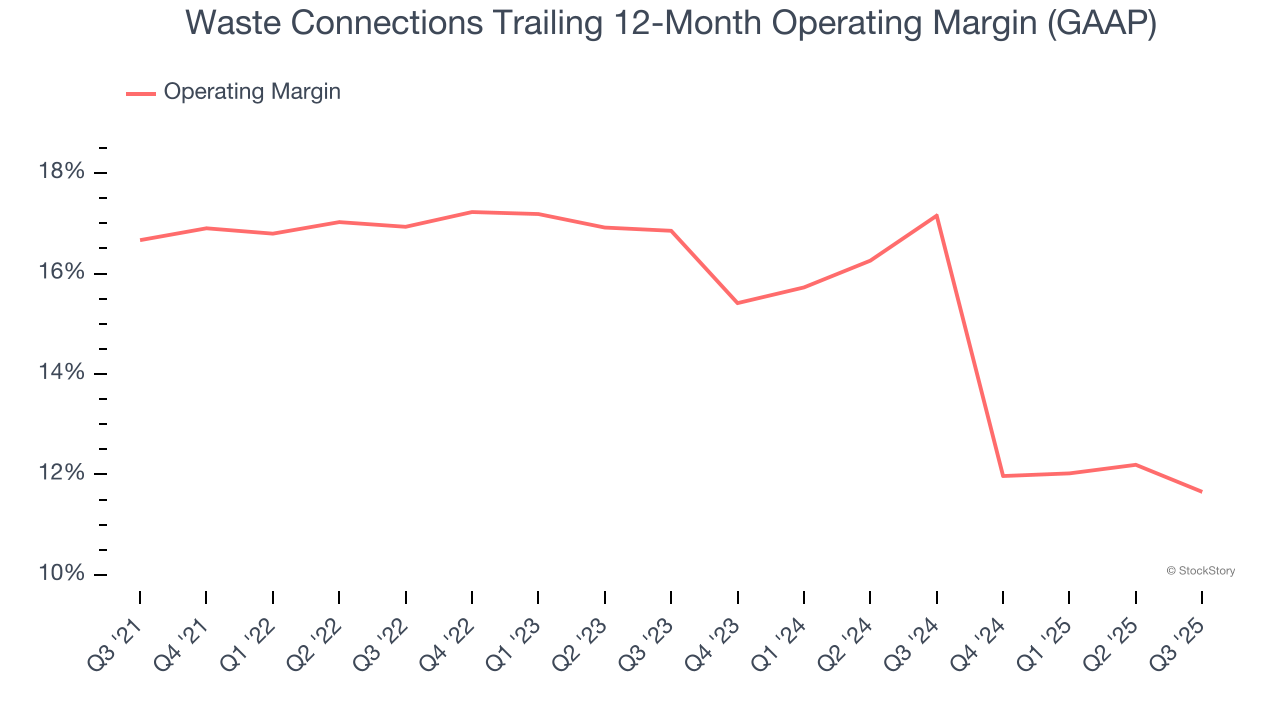
In Q3, Waste Connections generated an operating margin profit margin of 17.9%, down 2.4 percentage points year on year. Since Waste Connections’s operating margin decreased more than its gross margin, we can assume it was less efficient because expenses such as marketing, R&D, and administrative overhead increased.
Earnings Per Share
We track the long-term change in earnings per share (EPS) for the same reason as long-term revenue growth. Compared to revenue, however, EPS highlights whether a company’s growth is profitable.
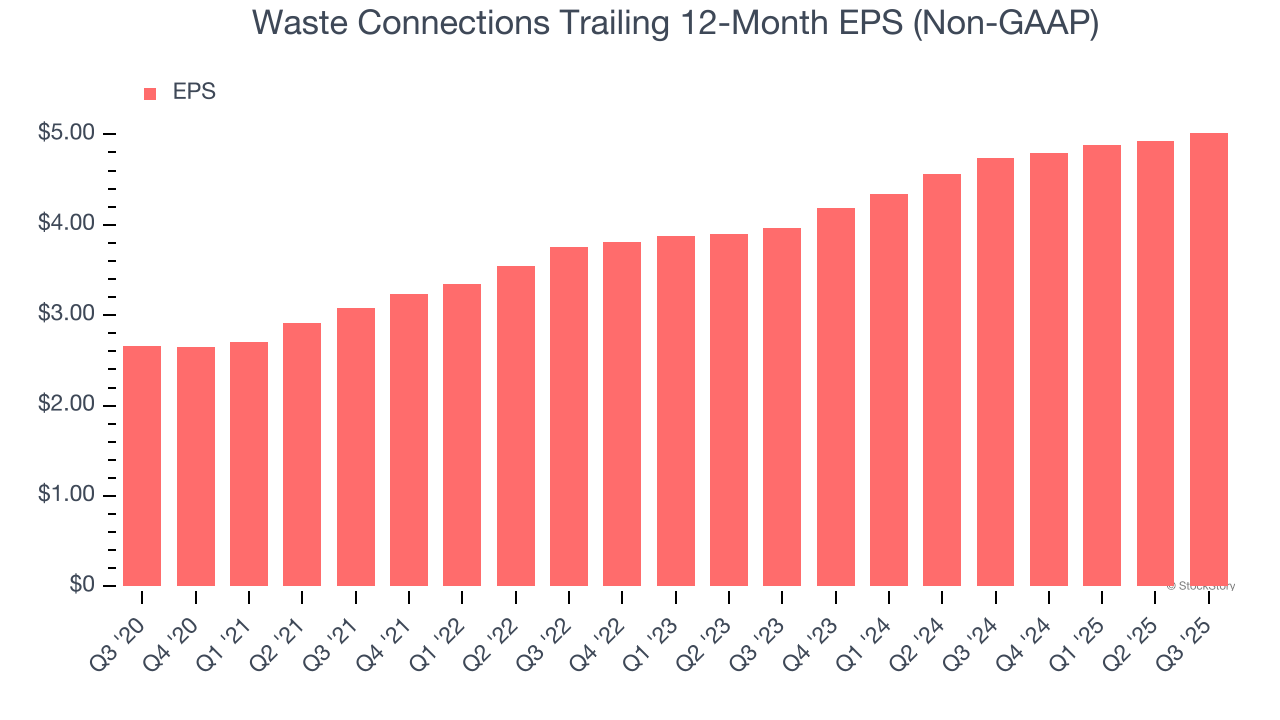
Waste Connections’s remarkable 13.5% annual EPS growth over the last five years aligns with its revenue performance. This tells us its incremental sales were profitable.
Like with revenue, we analyze EPS over a shorter period to see if we are missing a change in the business.
For Waste Connections, its two-year annual EPS growth of 12.4% was lower than its five-year trend. We still think its growth was good and hope it can accelerate in the future.
In Q3, Waste Connections reported adjusted EPS of $1.44, up from $1.35 in the same quarter last year. This print beat analysts’ estimates by 4.3%. Over the next 12 months, Wall Street expects Waste Connections’s full-year EPS of $5.02 to grow 10.8%.
Key Takeaways from Waste Connections’s Q3 Results
It was good to see Waste Connections beat analysts’ EPS expectations this quarter on in-line revenue. Looking ahead, full-year guidance was maintained from what was given previously. Overall, this quarter didn't have many surprises, good or bad. The stock remained flat at $175 immediately after reporting.
Should you buy the stock or not? The latest quarter does matter, but not nearly as much as longer-term fundamentals and valuation, when deciding if the stock is a buy. We cover that in our actionable full research report which you can read here, it’s free for active Edge members.