
Regional banking company Western Alliance Bancorporation (NYSE: WAL) announced better-than-expected revenue in Q3 CY2025, with sales up 15.2% year on year to $938.2 million. Its GAAP profit of $2.28 per share was 9.1% above analysts’ consensus estimates.
Is now the time to buy Western Alliance Bancorporation? Find out by accessing our full research report, it’s free for active Edge members.
Western Alliance Bancorporation (WAL) Q3 CY2025 Highlights:
- Net Interest Income: $750.4 million vs analyst estimates of $738.1 million (7.7% year-on-year growth, 1.7% beat)
- Net Interest Margin: 3.5% vs analyst estimates of 3.6% (5.3 basis point miss)
- Revenue: $938.2 million vs analyst estimates of $883.4 million (15.2% year-on-year growth, 6.2% beat)
- Efficiency Ratio: 57.4% vs analyst estimates of 61.1% (367.3 basis point beat)
- EPS (GAAP): $2.28 vs analyst estimates of $2.09 (9.1% beat)
- Tangible Book Value per Share: $58.56 vs analyst estimates of $57.65 (11.6% year-on-year growth, 1.6% beat)
- Market Capitalization: $8.22 billion
“Western Alliance achieved solid third quarter results with net income of $261 million and earnings per share of $2.28, up 10.1% from last quarter and 26.7% year-over-year. Healthy balance sheet growth and stable margins supported continued expansion of net interest income, which, alongside firming mortgage banking revenue, generated record PPNR1 of $394 million,” said Kenneth A. Vecchione, President and Chief Executive Officer.
Company Overview
Operating through five distinct regional banking divisions across the western United States, Western Alliance Bancorporation (NYSE: WAL) provides commercial banking, treasury management, mortgage services, and specialized financial solutions through its banking divisions and subsidiaries.
Sales Growth
Two primary revenue streams drive bank earnings. While net interest income, which is earned by charging higher rates on loans than paid on deposits, forms the foundation, fee-based services across banking, credit, wealth management, and trading operations provide additional income. Luckily, Western Alliance Bancorporation’s revenue grew at an incredible 23.3% compounded annual growth rate over the last five years. Its growth surpassed the average banking company and shows its offerings resonate with customers, a great starting point for our analysis.
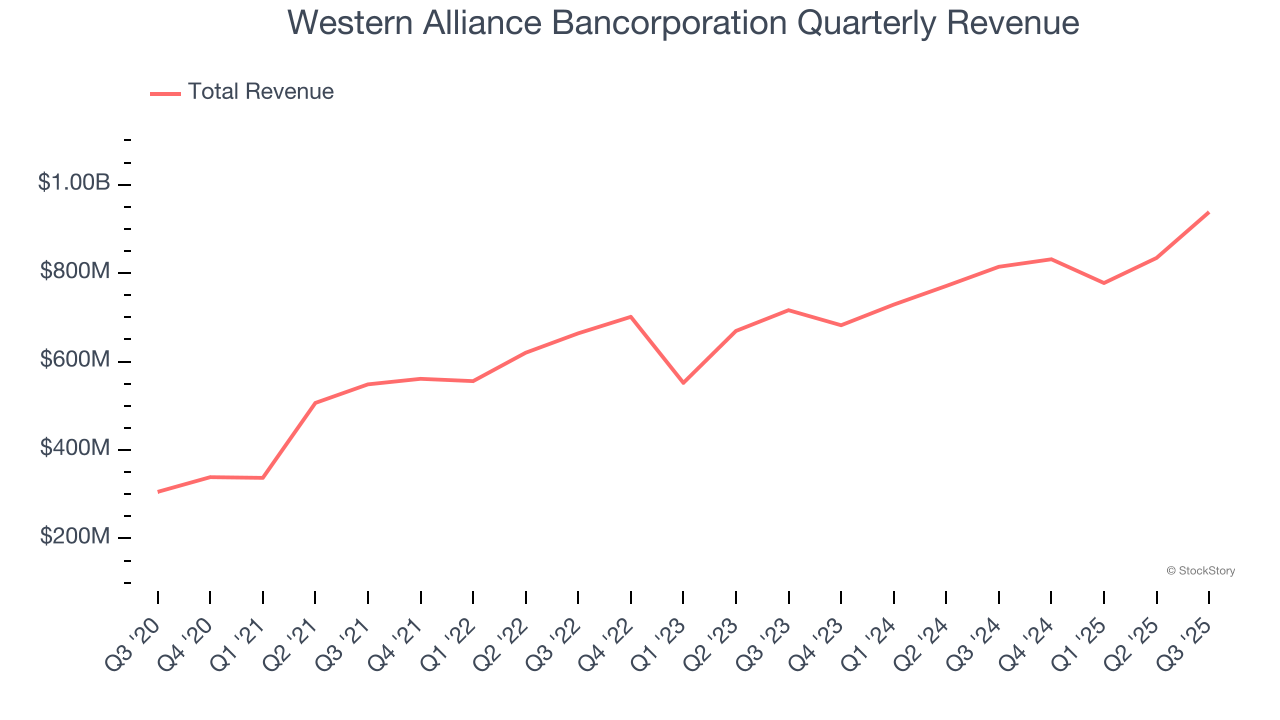
We at StockStory place the most emphasis on long-term growth, but within financials, a half-decade historical view may miss recent interest rate changes, market returns, and industry trends. Western Alliance Bancorporation’s annualized revenue growth of 13.2% over the last two years is below its five-year trend, but we still think the results suggest healthy demand. 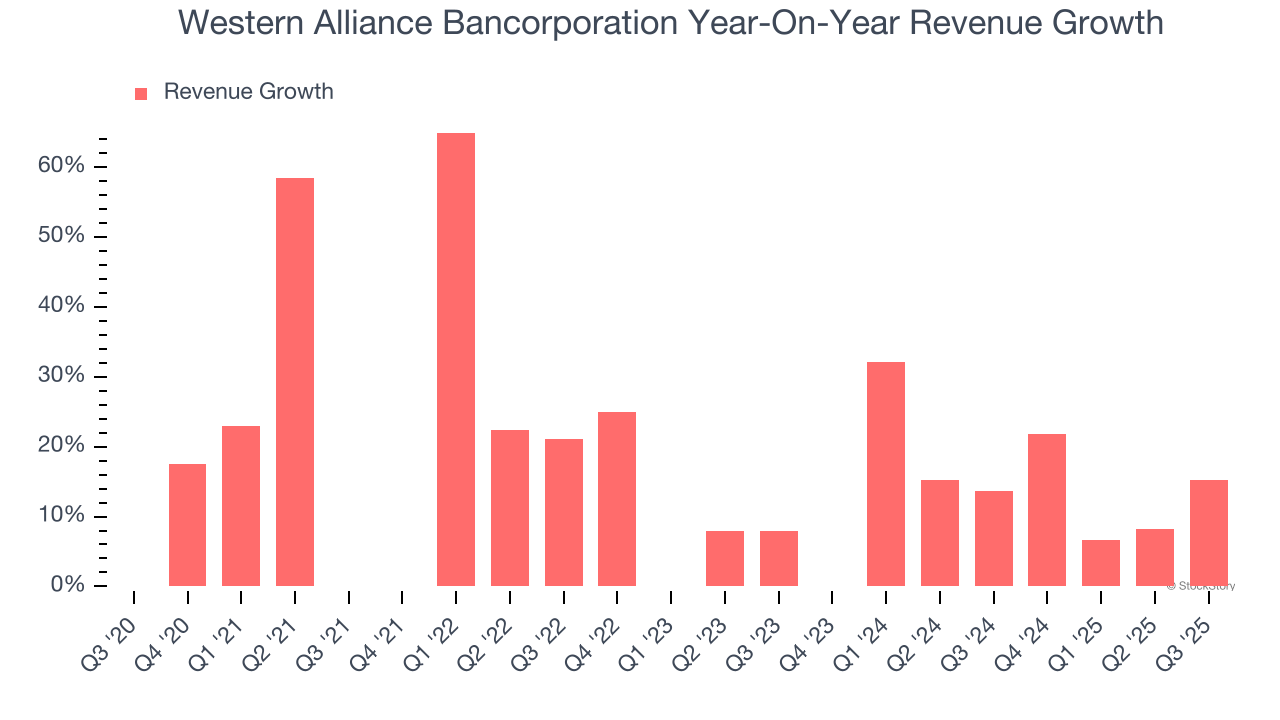 Note: Quarters not shown were determined to be outliers, impacted by outsized investment gains/losses that are not indicative of the recurring fundamentals of the business.
This quarter, Western Alliance Bancorporation reported year-on-year revenue growth of 15.2%, and its $938.2 million of revenue exceeded Wall Street’s estimates by 6.2%.
Net interest income made up 85.2% of the company’s total revenue during the last five years, meaning Western Alliance Bancorporation barely relies on non-interest income to drive its overall growth.
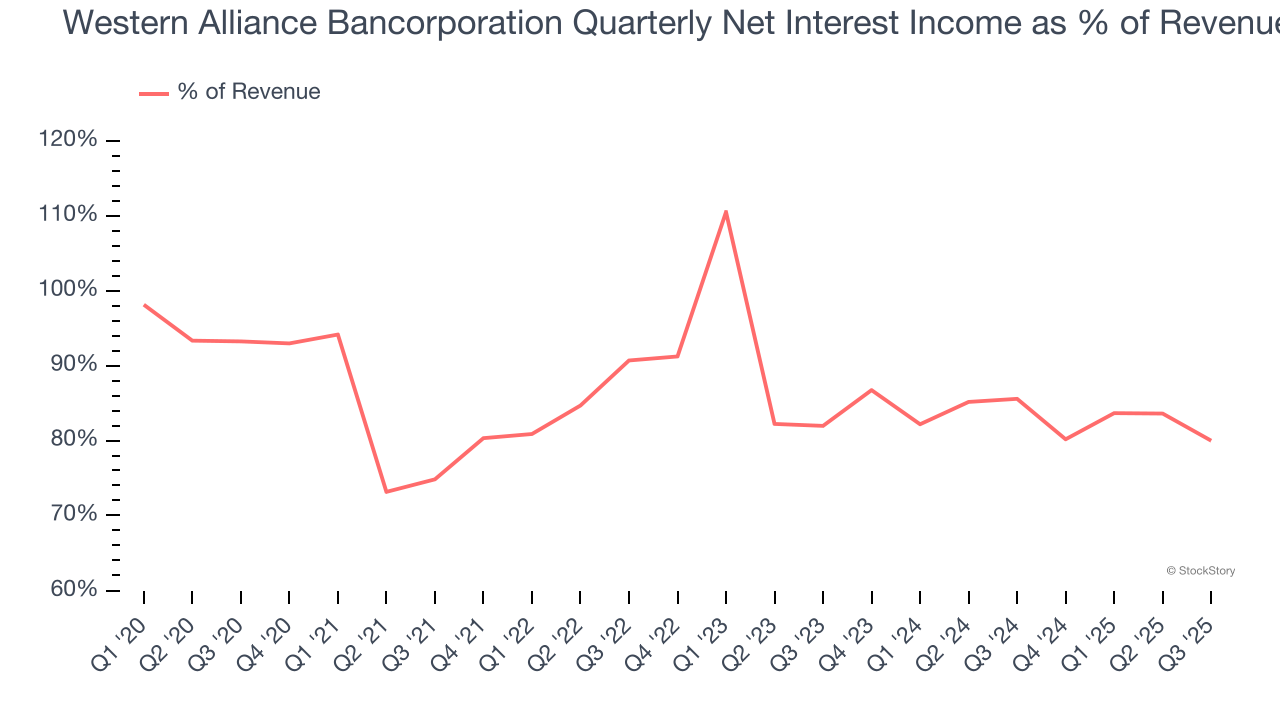
Our experience and research show the market cares primarily about a bank’s net interest income growth as non-interest income is considered a lower-quality and non-recurring revenue source.
Software is eating the world and there is virtually no industry left that has been untouched by it. That drives increasing demand for tools helping software developers do their jobs, whether it be monitoring critical cloud infrastructure, integrating audio and video functionality, or ensuring smooth content streaming. Click here to access a free report on our 3 favorite stocks to play this generational megatrend.
Tangible Book Value Per Share (TBVPS)
Banks are balance sheet-driven businesses because they generate earnings primarily through borrowing and lending. They’re also valued based on their balance sheet strength and ability to compound book value (another name for shareholders’ equity) over time.
This is why we consider tangible book value per share (TBVPS) the most important metric to track for banks. TBVPS represents the real, liquid net worth per share of a bank, excluding intangible assets that have debatable value upon liquidation. EPS can become murky due to acquisition impacts or accounting flexibility around loan provisions, and TBVPS resists financial engineering manipulation.
Western Alliance Bancorporation’s TBVPS grew at an incredible 14.9% annual clip over the last five years. The last two years show a similar trajectory as TBVPS grew by 15.3% annually from $44.02 to $58.56 per share.
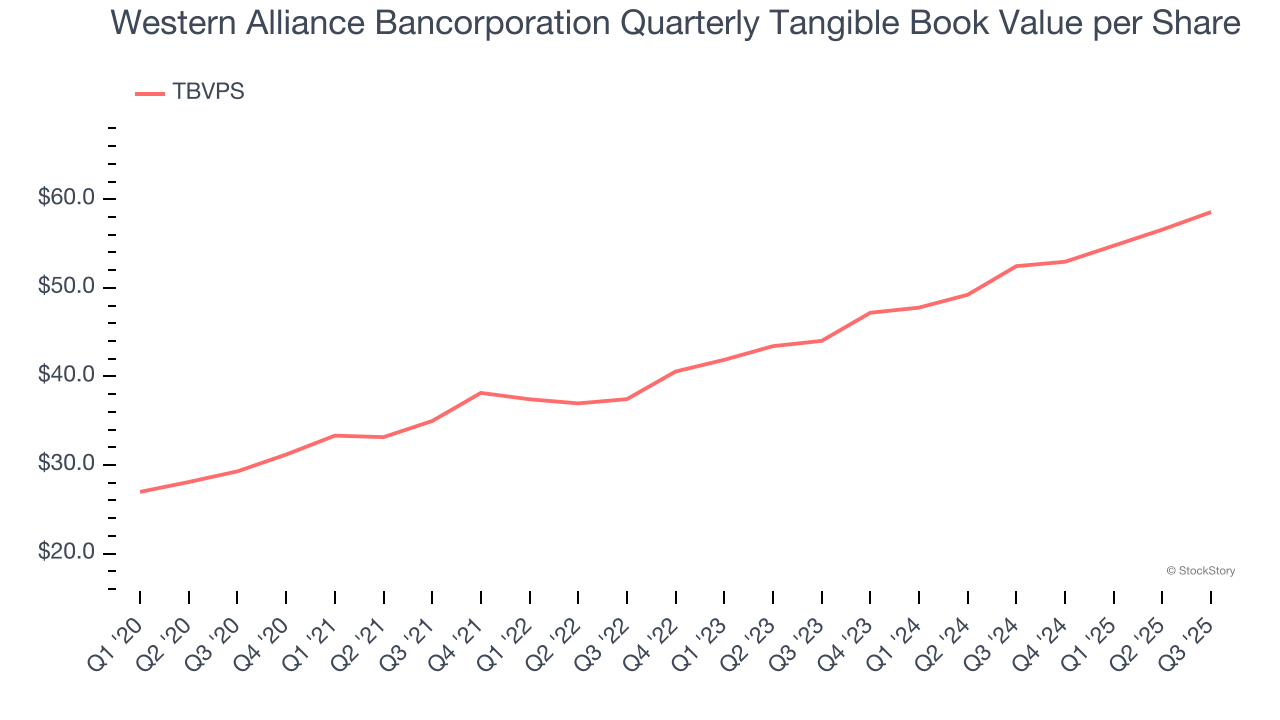
Over the next 12 months, Consensus estimates call for Western Alliance Bancorporation’s TBVPS to grow by 12.9% to $66.14, top-notch growth rate.
Key Takeaways from Western Alliance Bancorporation’s Q3 Results
We were impressed by how significantly Western Alliance Bancorporation blew past analysts’ revenue expectations this quarter. We were also happy its net interest income outperformed Wall Street’s estimates. Overall, we think this was a solid quarter with some key areas of upside. The stock traded up 3.7% to $79 immediately following the results.
Sure, Western Alliance Bancorporation had a solid quarter, but if we look at the bigger picture, is this stock a buy? What happened in the latest quarter matters, but not as much as longer-term business quality and valuation, when deciding whether to invest in this stock. We cover that in our actionable full research report which you can read here, it’s free for active Edge members.