
Palo Alto Networks trades at $214.02 per share and has stayed right on track with the overall market, gaining 30.8% over the last six months. At the same time, the S&P 500 has returned 27.3%.
Is now a good time to buy PANW? Find out in our full research report, it’s free for active Edge members.
Why Does PANW Stock Spark Debate?
Founded in 2005 by security visionary Nir Zuk who sought to reimagine firewall technology, Palo Alto Networks (NASDAQ: PANW) provides AI-powered cybersecurity platforms that protect organizations' networks, clouds, and endpoints from sophisticated threats.
Two Positive Attributes:
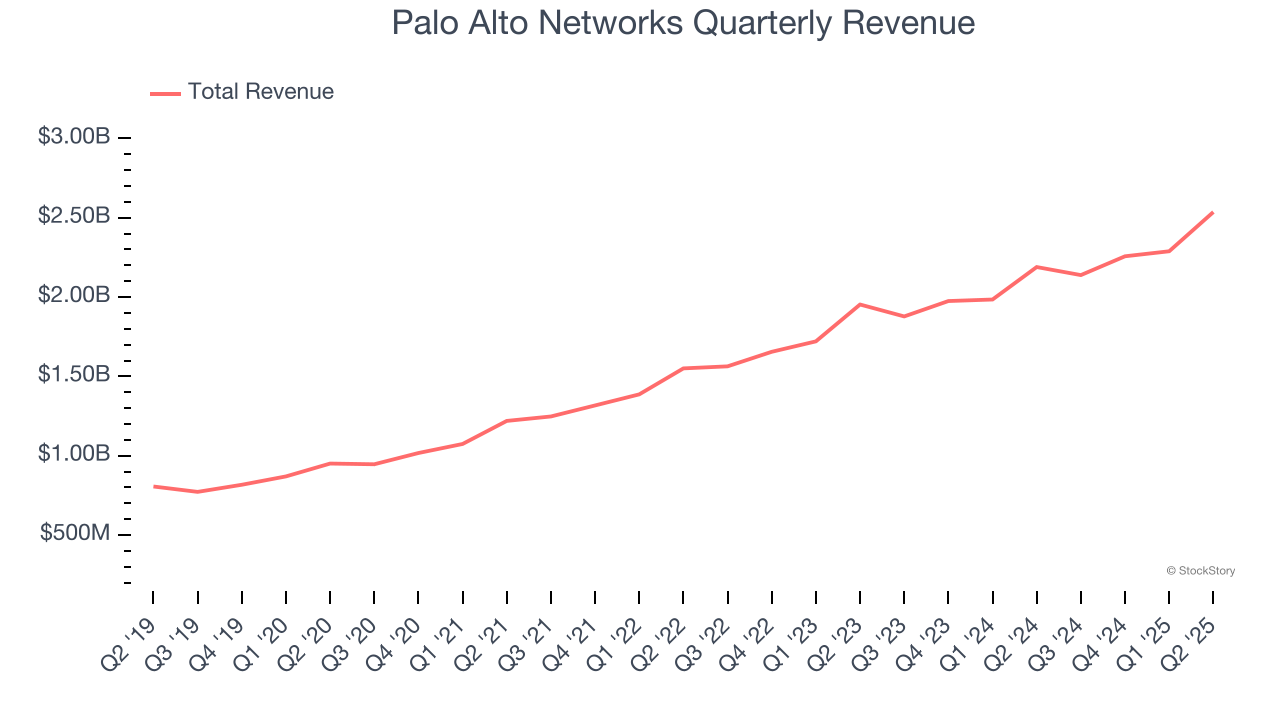
1. Long-Term Revenue Growth Shows Strong Momentum
A company’s long-term sales performance can indicate its overall quality. Any business can experience short-term success, but top-performing ones enjoy sustained growth for years. Over the last five years, Palo Alto Networks grew its sales at a solid 22% compounded annual growth rate. Its growth surpassed the average software company and shows its offerings resonate with customers.
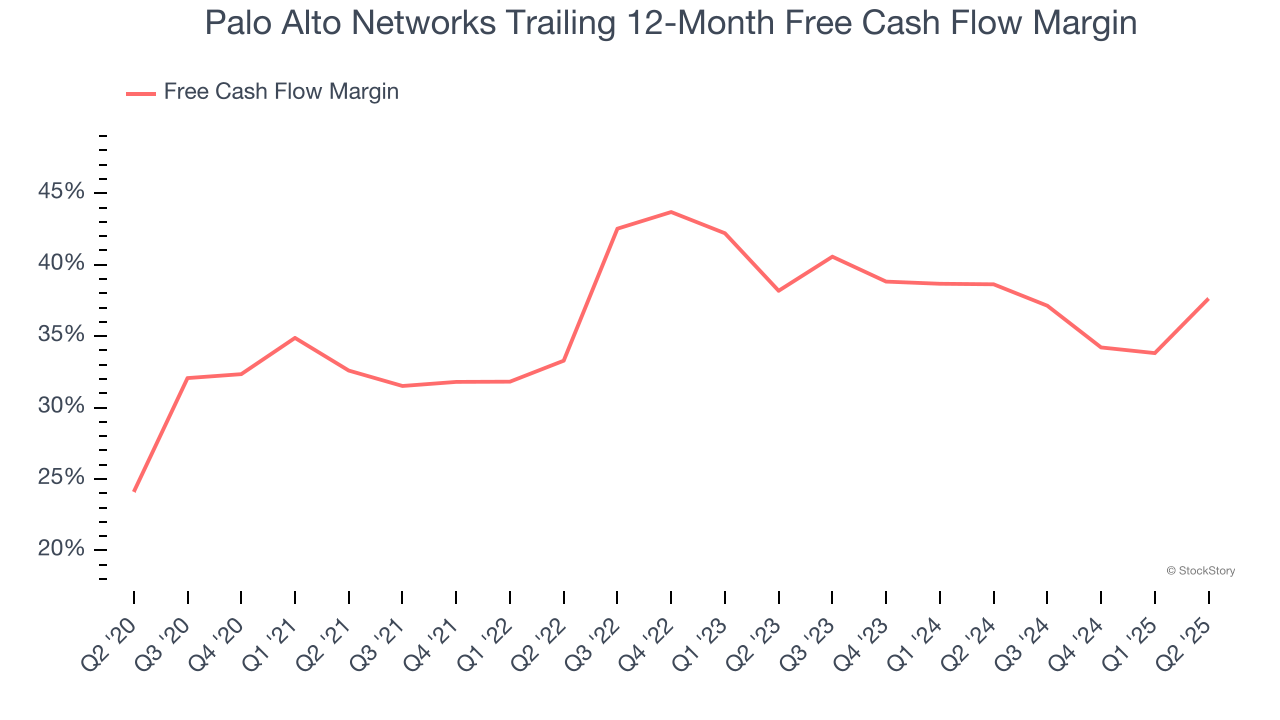
2. Excellent Free Cash Flow Margin Boosts Reinvestment Potential
Free cash flow isn't a prominently featured metric in company financials and earnings releases, but we think it's telling because it accounts for all operating and capital expenses, making it tough to manipulate. Cash is king.
Palo Alto Networks has shown terrific cash profitability, driven by its cost-effective customer acquisition strategy that enables it to stay ahead of the competition through investments in new products rather than sales and marketing. The company’s free cash flow margin was among the best in the software sector, averaging an eye-popping 37.6% over the last year.
One Reason to be Careful:
Weak Billings Point to Soft Demand
Billings is a non-GAAP metric that is often called “cash revenue” because it shows how much money the company has collected from customers in a certain period. This is different from revenue, which must be recognized in pieces over the length of a contract.
Palo Alto Networks’s billings came in at $3.71 billion in Q2, and over the last four quarters, its year-on-year growth averaged 1.8%. This performance was underwhelming and suggests that increasing competition is causing challenges in acquiring/retaining customers. 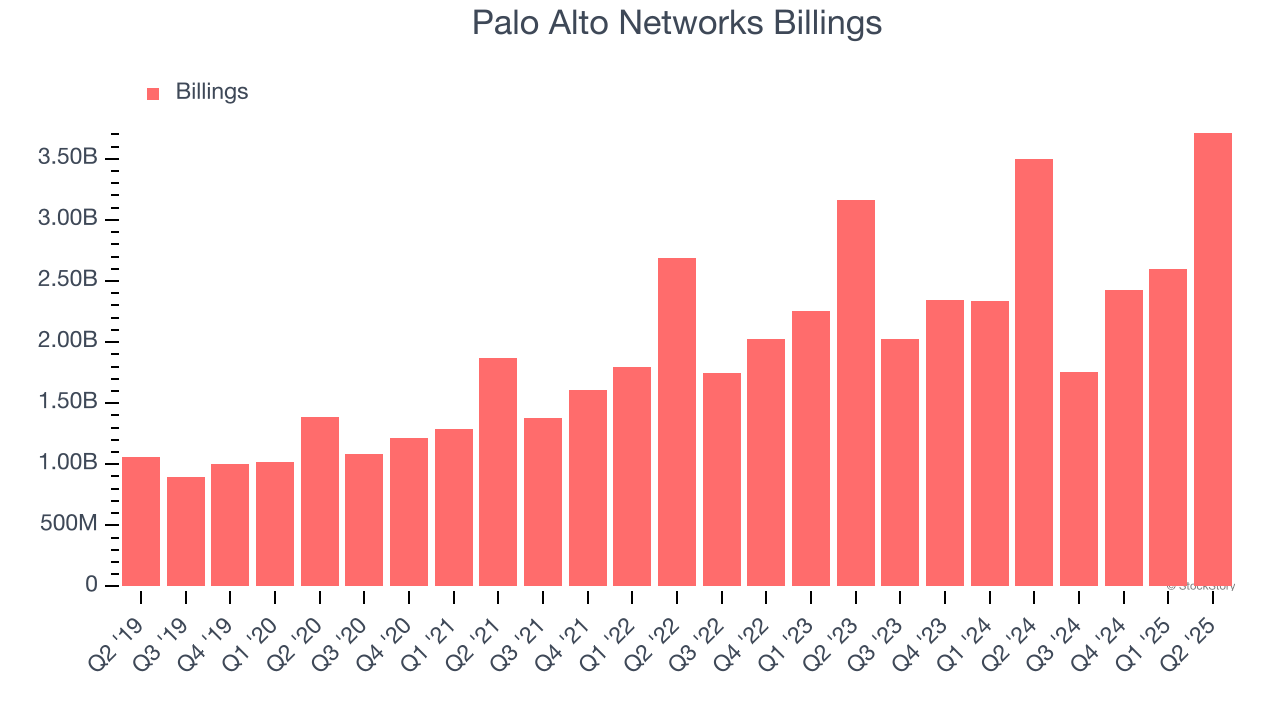
Final Judgment
Palo Alto Networks’s merits more than compensate for its flaws, but at $214.02 per share (or 14.5× forward price-to-sales), is now the right time to buy the stock? See for yourself in our comprehensive research report, it’s free for active Edge members .
Stocks We Like Even More Than Palo Alto Networks
Trump’s April 2025 tariff bombshell triggered a massive market selloff, but stocks have since staged an impressive recovery, leaving those who panic sold on the sidelines.
Take advantage of the rebound by checking out our Top 5 Strong Momentum Stocks for this week. This is a curated list of our High Quality stocks that have generated a market-beating return of 183% over the last five years (as of March 31st 2025).
Stocks that made our list in 2020 include now familiar names such as Nvidia (+1,545% between March 2020 and March 2025) as well as under-the-radar businesses like the once-small-cap company Exlservice (+354% five-year return). Find your next big winner with StockStory today.
StockStory is growing and hiring equity analyst and marketing roles. Are you a 0 to 1 builder passionate about the markets and AI? See the open roles here.