
Perdoceo Education has been on fire lately. In the past six months alone, the company’s stock price has rocketed 46.4%, reaching $36.43 per share. This was partly due to its solid quarterly results, and the run-up might have investors contemplating their next move.
Is now still a good time to buy PRDO? Or are investors being too optimistic? Find out in our full research report, it’s free for active Edge members.
Why Does PRDO Stock Spark Debate?
Formerly known as Career Education Corporation, Perdoceo Education (NASDAQ: PRDO) is an educational services company that specializes in postsecondary education.
Two Positive Attributes:
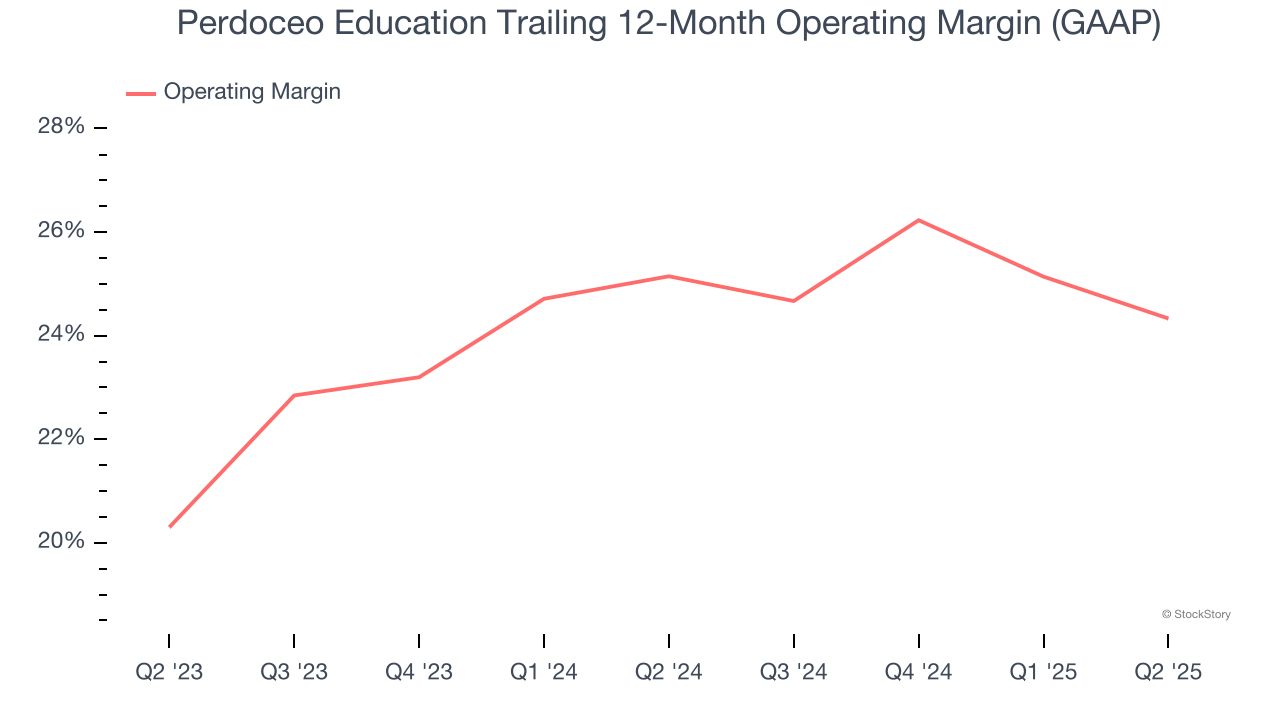
1. Operating Margin Reveals a Well-Run Organization
Operating margin is an important measure of profitability as it shows the portion of revenue left after accounting for all core expenses – everything from the cost of goods sold to advertising and wages. It’s also useful for comparing profitability across companies with different levels of debt and tax rates because it excludes interest and taxes.
Perdoceo Education’s operating margin might fluctuated slightly over the last 12 months but has remained more or less the same, averaging 24.7% over the last two years. This profitability was elite for a consumer discretionary business thanks to its efficient cost structure and economies of scale.
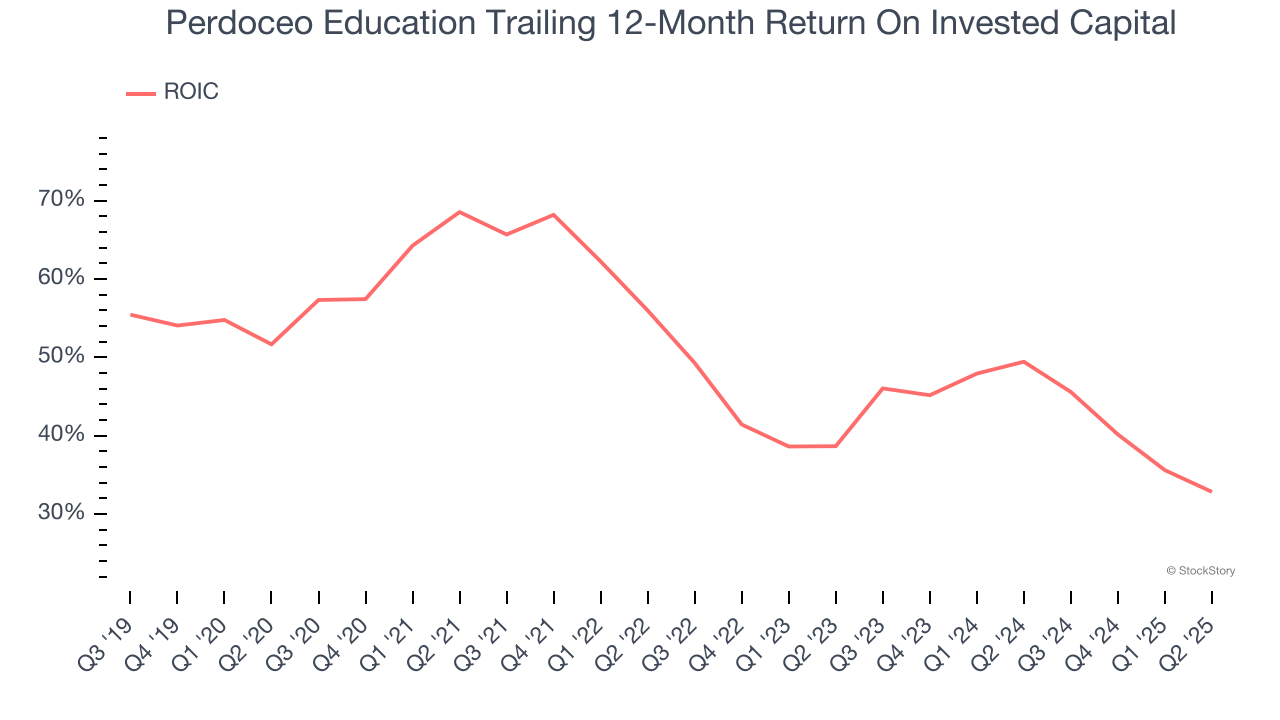
2. Stellar ROIC Showcases Lucrative Growth Opportunities
Growth gives us insight into a company’s long-term potential, but how capital-efficient was that growth? Enter ROIC, a metric showing how much operating profit a company generates relative to the money it has raised (debt and equity).
Perdoceo Education’s five-year average ROIC was 49.1%, placing it among the best consumer discretionary companies. This illustrates its management team’s ability to invest in highly profitable ventures and produce tangible results for shareholders.
One Reason to be Careful:
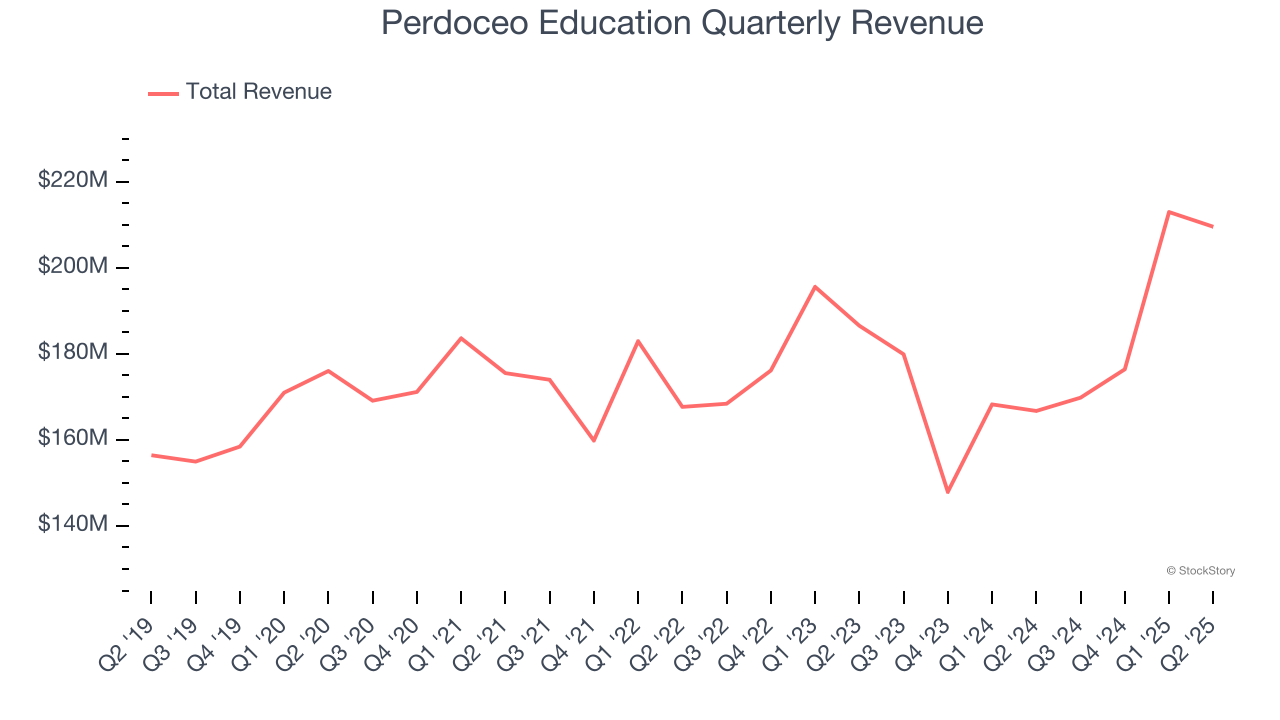
Long-Term Revenue Growth Disappoints
A company’s long-term performance is an indicator of its overall quality. Any business can put up a good quarter or two, but many enduring ones grow for years. Unfortunately, Perdoceo Education’s 3.1% annualized revenue growth over the last five years was sluggish. This wasn’t a great result compared to the rest of the consumer discretionary sector, but there are still things to like about Perdoceo Education.
Final Judgment
Perdoceo Education’s positive characteristics outweigh the negatives, and with the recent rally, the stock trades at 22.5× forward EV-to-EBITDA (or $36.43 per share). Is now the time to initiate a position? See for yourself in our comprehensive research report, it’s free for active Edge members .
Stocks We Like Even More Than Perdoceo Education
When Trump unveiled his aggressive tariff plan in April 2025, markets tanked as investors feared a full-blown trade war. But those who panicked and sold missed the subsequent rebound that’s already erased most losses.
Don’t let fear keep you from great opportunities and take a look at Top 6 Stocks for this week. This is a curated list of our High Quality stocks that have generated a market-beating return of 183% over the last five years (as of March 31st 2025).
Stocks that made our list in 2020 include now familiar names such as Nvidia (+1,545% between March 2020 and March 2025) as well as under-the-radar businesses like the once-micro-cap company Kadant (+351% five-year return). Find your next big winner with StockStory today.
StockStory is growing and hiring equity analyst and marketing roles. Are you a 0 to 1 builder passionate about the markets and AI? See the open roles here.


