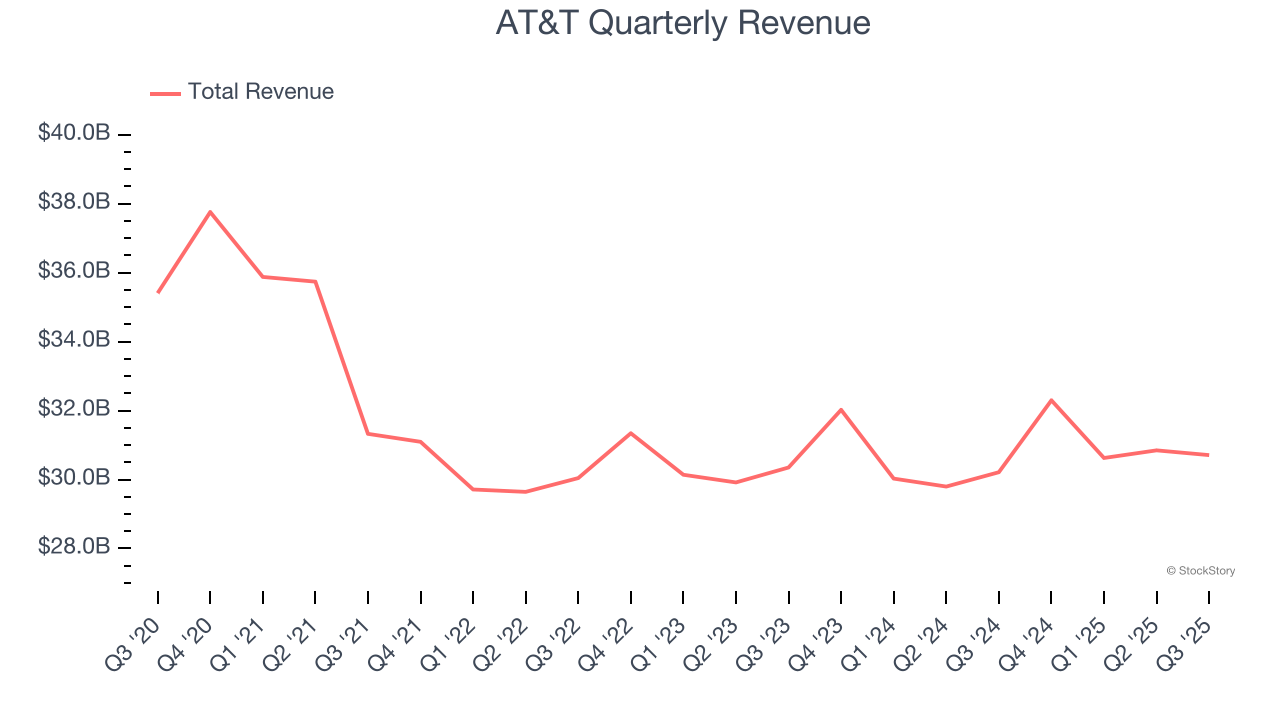
Telecommunications conglomerate AT&T (NYSE: T) met Wall Street’s revenue expectations in Q3 CY2025, with sales up 1.6% year on year to $30.71 billion. Its GAAP profit of $1.29 per share was significantly above analysts’ consensus estimates.
Is now the time to buy AT&T? Find out by accessing our full research report, it’s free for active Edge members.
AT&T (T) Q3 CY2025 Highlights:
- Revenue: $30.71 billion vs analyst estimates of $30.85 billion (1.6% year-on-year growth, in line)
- EPS (GAAP): $1.29 vs analyst estimates of $0.53 (significant beat)
- Operating Margin: 19.9%, up from 7% in the same quarter last year
- Free Cash Flow Margin: 17.1%, similar to the same quarter last year
- Wireless subs adds: 405,000 vs expectations of 334,100 adds
- Market Capitalization: $186.3 billion
Company Overview
Founded by Alexander Graham Bell, AT&T (NYSE: T) is a multinational telecomm conglomerate providing a range of communications and internet services.
Revenue Growth
Reviewing a company’s long-term sales performance reveals insights into its quality. Any business can experience short-term success, but top-performing ones enjoy sustained growth for years. AT&T struggled to consistently generate demand over the last five years as its sales dropped at a 5.6% annual rate. This was below our standards and suggests it’s a low quality business.
Long-term growth is the most important, but within consumer discretionary, product cycles are short and revenue can be hit-driven due to rapidly changing trends and consumer preferences. AT&T’s annualized revenue growth of 1.1% over the last two years is above its five-year trend, but we were still disappointed by the results. 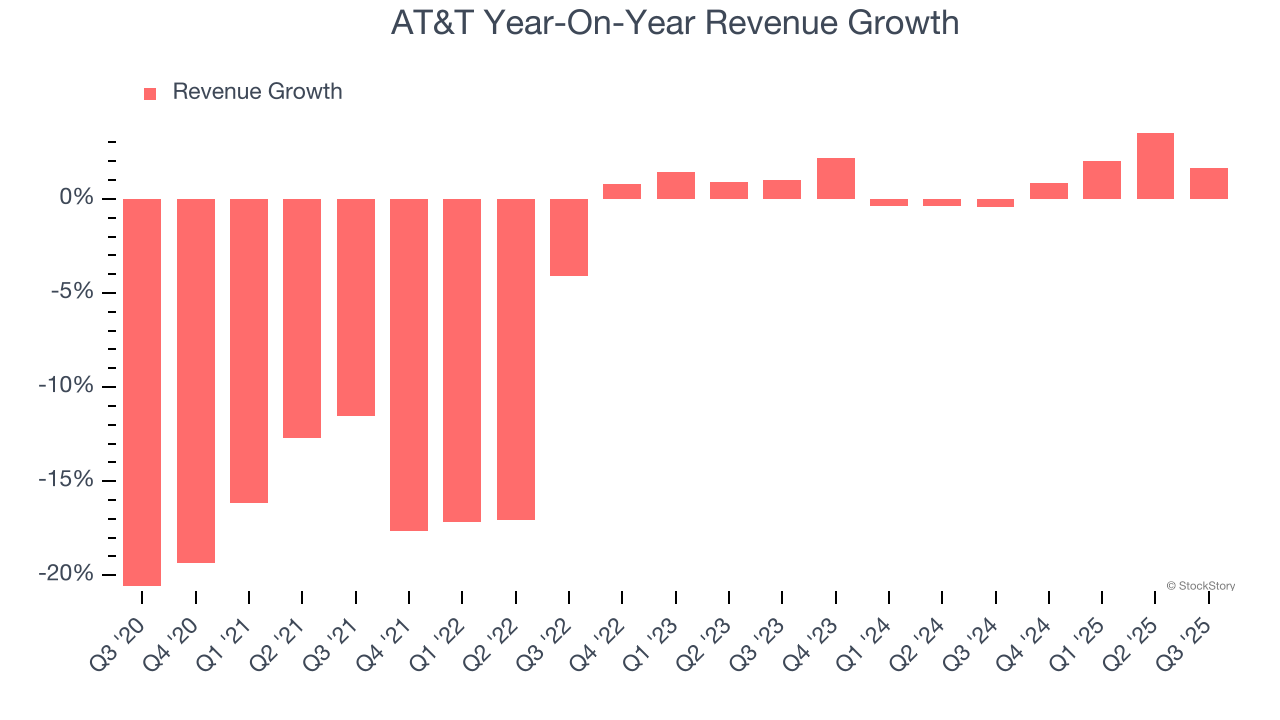
We can dig further into the company’s revenue dynamics by analyzing its most important segment, Mobility. Over the last two years, AT&T’s Mobility revenue (wireless plans) averaged 3.1% year-on-year growth. This segment has outperformed its total sales during the same period, lifting the company’s performance. 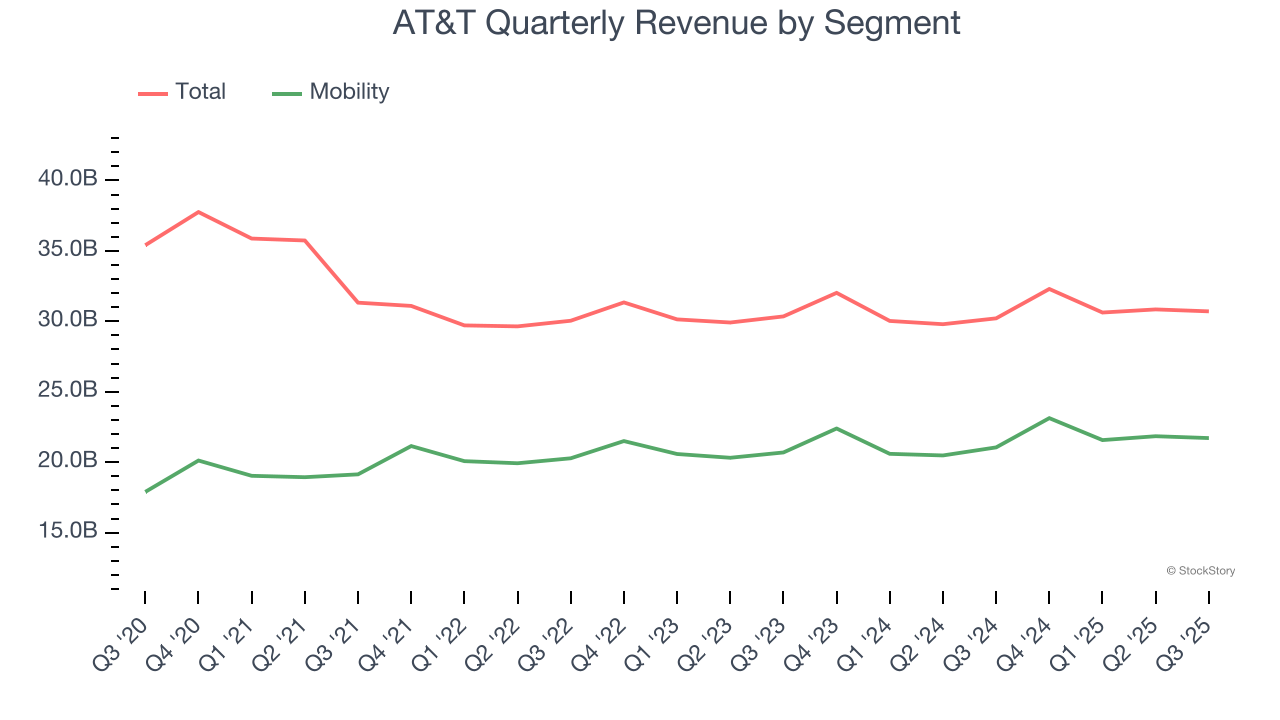
This quarter, AT&T grew its revenue by 1.6% year on year, and its $30.71 billion of revenue was in line with Wall Street’s estimates.
Looking ahead, sell-side analysts expect revenue to grow 1.5% over the next 12 months, similar to its two-year rate. This projection doesn't excite us and suggests its newer products and services will not catalyze better top-line performance yet.
Today’s young investors won’t have read the timeless lessons in Gorilla Game: Picking Winners In High Technology because it was written more than 20 years ago when Microsoft and Apple were first establishing their supremacy. But if we apply the same principles, then enterprise software stocks leveraging their own generative AI capabilities may well be the Gorillas of the future. So, in that spirit, we are excited to present our Special Free Report on a profitable, fast-growing enterprise software stock that is already riding the automation wave and looking to catch the generative AI next.
Operating Margin
Operating margin is an important measure of profitability as it shows the portion of revenue left after accounting for all core expenses – everything from the cost of goods sold to advertising and wages. It’s also useful for comparing profitability across companies with different levels of debt and tax rates because it excludes interest and taxes.
AT&T’s operating margin has risen over the last 12 months and averaged 17.3% over the last two years. On top of that, its profitability was top-notch for a consumer discretionary business, showing it’s an well-run company with an efficient cost structure.
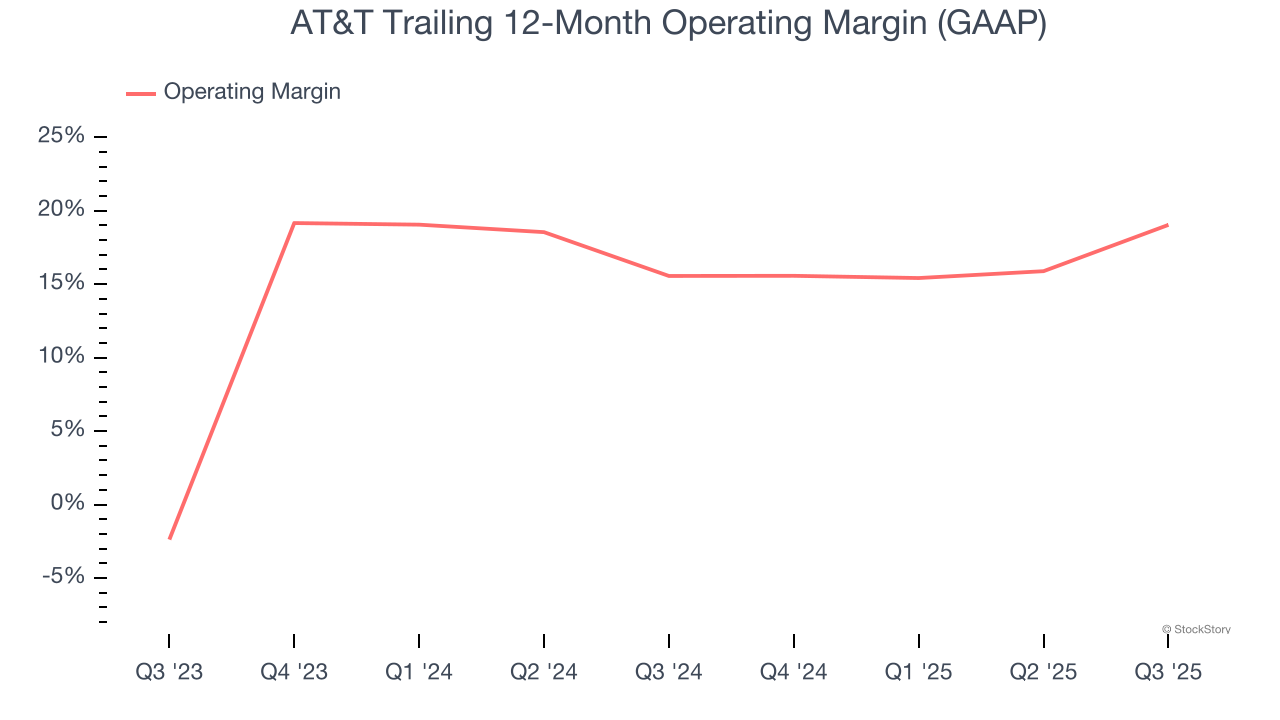
In Q3, AT&T generated an operating margin profit margin of 19.9%, up 12.9 percentage points year on year. This increase was a welcome development and shows it was more efficient.
Earnings Per Share
We track the long-term change in earnings per share (EPS) for the same reason as long-term revenue growth. Compared to revenue, however, EPS highlights whether a company’s growth is profitable.
AT&T’s EPS grew at a solid 14.9% compounded annual growth rate over the last five years, higher than its 5.6% annualized revenue declines. This tells us management adapted its cost structure in response to a challenging demand environment.
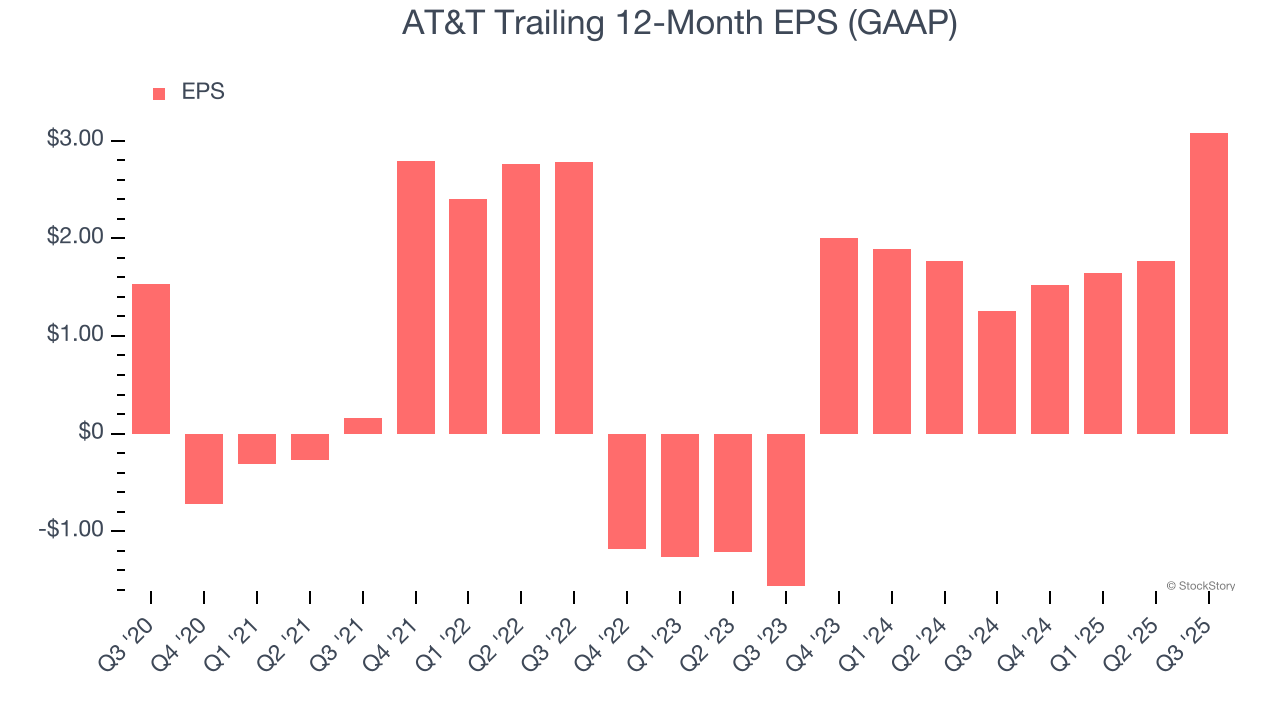
In Q3, AT&T reported EPS of $1.29, up from negative $0.02 in the same quarter last year. This print easily cleared analysts’ estimates, and shareholders should be content with the results. Over the next 12 months, Wall Street expects AT&T’s full-year EPS of $3.08 to shrink by 31%.
Key Takeaways from AT&T’s Q3 Results
It was good to see AT&T beat analysts’ wireless sub net adds and EPS expectations this quarter. On the other hand, its revenue was just in line with Wall Street’s estimates. Overall, we think this was still a decent quarter with some key metrics above expectations. The stock remained flat at $26.27 immediately after reporting.
Indeed, AT&T had a rock-solid quarterly earnings result, but is this stock a good investment here? If you’re making that decision, you should consider the bigger picture of valuation, business qualities, as well as the latest earnings. We cover that in our actionable full research report which you can read here, it’s free for active Edge members.